Monday, March 28, 2011

AXT Inc.


Click on the above image to enlarge

I am currently fully invested in "ATXI" at $6.2. I am currently up by 18% as of time of writing. Should I realize my gain now or should I wait for this stock to go up further? Anyone know the answer?  I am afraid not. Nobody will know the freaking answer unless you are a god, angel, demon or someone who have the superpower ability.

Anyway, back to the serious issue here, I am currently expecting this stock to move up to at least $8 and above. However I foresee that this stock will hit a major resistance at around $8.80 area. The reason is I am targeting this stock to correct at least 50% of the recent downturn. I am taking the recent downward move and divided by half to get my long target. It is further supported by the technical indicators such as MACD, RSI and Stochastic Indicator. I am expecting that those indicators will move up to touch the red circle above before it starts to hit the resistance and then move futher downward. It will coincide nicely with the 50% retracement for the downward move that I have predicted.

I will consider to sell this stock only if it can hit above $8.40 and above. Otherwise, I will patiently wait for this stock to perform as per my expectation. After all, AXTI is a fundamental sound stock with a good solig earning growth. Kindly refer to my previous post for the revenue growth report.

I will post my earning report once I sold this stock. At the meantime, kindly stay tune to this blog for further Sucker Punch activities!

Tuesday, March 22, 2011

Technical Analysis is Not Necessarily Correct


 Click on the above image to enlarge

I am currently in a big dilemma as I am currently long in Axti. I am rather confused as well when I study the technical on this chart. It appears that all technical indicators such as Stochastic, MACD and Bollinger  Band point to an upward move for this stock. However, for the past 2 days, this stock is not advancing as expected. Instead, it is currently trading sideways with low volume. The recent days low volume is definitely not a good sign because it shows that although the stock is rebounding from the previous low, however, it is still very weak as the buyer is not stepping in. 
There is a also a downward gap at around $8.3 to $7.7 level. I am also expecting that this gap will be filled going forward. But I might be wrong because not all gap are filled. If this gap is filled, then I am guarantee a profit of more than 20%. However, as I point it out in my heading, not all technical analysis is accurate and sometimes I may be wrong and the stock will go the opposite way instead. 

I really spent a lot of hours look and analyzing this stock. Even though I strongly believe that this stock will go up in the coming months but there is not guarantee to it. 

I have recently read a very interesting article on how good this stock is but it still no guarantee that this stock is going up. This article by Ben Axler was published on the famous website www.seekingalpha.com on March 21, 2011, however, on March 22 and 23, the stock go down instead by around 2 percents.

I have been trading the stock market for more than 12 years already and reading stock chart should be my forte, however, I admit that from time to time, I did make few big mistakes and it cost me hundred thousand of dollars. Trading in the market is truly not an easy game for anybody, once must have the discipline and able to control the emotion such as greed and fear. As Alexander the Great once said "Control your fear and you conquer death". I would say "Control your fear and you conquer wealth". 

I am currently long in Axti. If these few days the stock is not performing as expected, I will not hesitate to cut loss as I have place my cut loss level at $6.00.

================================================
Below is a very good article published by Ben Axler on AXT Inc. 

AXT Inc.: Oversold and Undervalued Technology Stock 

AXT Inc. (AXTI) is a very attractive business currently trading at a compelling valuation. AXTI is coming off its best year ever and is poised for increasing sales and earnings in the coming years, as the end markets for its products tied to mobile smart phones, LED and solar technology increase.
Company Overview:
AXTI is a leading developer and producer of high-performance compound and single element semiconductor substrates, including substrates made from gallium arsenide (GaAs), indium phosphide (InP) and germanium (Ge). The substrates are primarily semi-insulating and semi-conducting.
End Markets: Power amplifiers and radio frequency integrated circuits for wireless handsets (cell phones), direct broadcast television, high-performance transistors, satellite communications, high brightness light-emitting diodes, optical couplers, satellite and terrestrial solar cells, lasers, and optical couplers.
Manufacturing: AXTI manufactures all semiconductor substrates using its proprietary vertical gradient freeze (VGF) technology. Most of its revenue is from sales of GaAs substrates. It manufactures all of its products in China, which generally has favorable costs for facilities and labor compared with comparable facilities in the United States, Europe or Japan. It also has five joint ventures in China that provide pricing advantages, reliable supply and shorter lead-times for raw materials central to final manufactured products.
Customers: Its 10 largest customers for 2010 were: Avago Technologies Trading Ltd. (AVGO); AZUR Space Solar Power GmbH; Beijing China Crystal Technology Ltd.; Hitachi Cable Ltd.; The IQE Group; Nan Da Guang Dang; Osram Opto Semiconductors GmbH; Sumika Electronic Materials, Inc.; Sumitomo Chemical Co. Ltd. (SOMMF.PK) and Visual Photonics Epitaxy Co.
Competition: Primary competition in the market for compound semiconductor substrates includes Beijing Compound Crystal Technology, Ltd.; Freiberger Compound Materials; Mitsubishi Chemical Corporation; and Sumitomo Electric Industries. AXTI believes at least two of its competitors are shipping high volumes of GaAs substrates manufactured using a technique similar to its VGF technique. In addition, it also faces competition from compound semiconductor device manufacturers that produce substrates for their own internal use, including Hitachi (HIT), and from companies such as IBM that are actively developing alternative compound semiconductor materials. AXTI is the only compound semiconductor substrate supplier to offer a full suite of raw materials.
Investment Thesis:
AXTI's business model is attractive for a number of reasons including:
1. High barriers to entry in its industry with a supply chain that is nearly impossible to replicate. It has joint venture ownership interests in numerous Chinese companies that control extremely rare and critical materials called gallium, germanium and indium. These materials are so limited in production that they were labelled as critical materials by the EU.
These JVs were set up over the course of the past 10 years, and represent significant hidden value to shareholders. The JVs ensure critical raw materials in the supply chain and partially insulate the company against the cost pressures facing its competition. The company spent the better part of the decade optimizing its supply chain and seeking high client qualification requirements to win business and slowly take market share. Given China's increasingly tight grip on rare earth elements and critical materials in the past few years, it would be extremely difficult, if not impossible, to reproduce what AXTI has accomplished.
[Click all to enlarge]


2. Few competitors and increasing market share. There are very few competitors in the markets AXTI sells to, and none control the supply chain like it does. A few main competitors are located in Japan, and as of this write-up, there are reports that Hitachi Cable has had some severe issues and may be offline for several weeks or even a couple of months. Competitor Sumitomo appears to be nearly unaffected, as its crystal growth is well south of Tokyo. Nevertheless, given the precarious position of having a high concentration of supply in Japan, customers may increasingly turn to AXTI for a more secure/stable source of product supply. Given capacity expansions in recent years and further planned expansion, AXTI may be best positioned to respond to customer demands.
3. Operating leverage: There's tremendous operating leverage in the business due to its low cost operations in China. While sales have grown at a 5yr CAGR of 38%, SG&A has grown at sub 2%. SG&A margin has fallen from almost 50% in 2005 to 14.6% in 2010. Likewise, years of R&D spending are finally paying off and have decreased from 6.5% of sales in 2005 to 2.4% of sales in 2010. Most R&D spending goes to process improvement and manufacturing efficiency research. Gross margin improvement has increased from the mid-20% range in 2008/2009 to a record 39.8% in Q4'10. This margin improvement is despite increasing gallium/germanium/indium raw material costs. Management has guided steady state gross margins in the 35-40% range, so anything above 40% represents material upside.

4. Minimal capex requirements to expand capacity to meet growing customer demand: Total manufacturing space in China is ~190,000 square feet, 160,000 square feet of which is currently being used; the company is currently preparing the remaining 30,000 square feet for increased wafer processing. It also expects to begin construction of a new 80,000 sq ft facility in Beijing. Competitors typically purchase crystal growing furnaces from original equipment manufacturers. In contrast, AXTI designs and builds its own VGF crystal growing furnaces, which it believes should allow it to increase production capacity more quickly and cost-effectively. Total capex is estimated to be $11m in 2011 and should easily be covered by cash from operations.
Recent Developments:
AXTI's share price had steadily been rising throughout 2009-2010 as it recovered from the industry downturn and proved capable of consistently delivering earnings ahead of its guidance. The company attracted two research brokers, including Needham and Northland, who each placed $10+ targets and backed the company's outlook for strong secular growth.
In the recent quarter, the company met its quarterly estimates, but offered softer Q1'11 guidance than the overly bullish analysts had hoped for by only 2 cents, due to a seasonally weak Q1 LED market. Even though the company's Q1'11 guidance range of $0.11-0.13 cents/share represents 28-63% growth over Q1'10 results of $0.08 cents/share, analysts aggressively cut estimates for 2011 almost to the point of expecting no EPS growth, and the stock has fallen over 50% from its highs earlier this year.
Part of the precipitous stock decline can be explained by the fact that AXTI's two largest shareholders are quant fund managers, and as short sellers piled in, the selling pressure was exacerbated. As a result, AXTI's stock price is excessively discounted by any extreme valuation measure. To put the current price in perspective, AXTI's share price has fallen to a level it traded at in 2007. Yet in 2007 revenues/eps were $58m/$0.16c vs. today at $95m/$0.59c. Clearly, the price drop is excessive in relation to the tremendous growth and operational improvement AXTI has experienced and will see going forward.
The trading value comparables indicate AXTI has one of the best EBITDA margins, and growth prospects, yet trades at a meaningful discount to peers such as TriQuint (TQNT), Oclaro (OCLR), Avago, Rubicon Technology (RBCN), Kopin (KOPN), Emcore (EMKR), Anadigics (ANAD) and IQE.
Comps
The balance sheet is strong with plenty of cash and no debt. I calculate the working capital per share is $2.78 vs. a $6.45 stock price. Looked at another way, almost 45% of the stock price is in working capital. Alternatively, with $1.27 in cash, ~20% of the stock price is backed by cash. These figures offer exceptional margin of safety at today's price.
On a cash-adjusted basis, AXTI's sub 9x P/E valuation looks even more compelling as does a forward EBITDA multiple below 6x.

Catalysts:
AXTI is now in the penalty box with analysts and quant funds after the past quarter; it's now a show-me story and will have to prove out that Q1 is just a seasonal hiccup and not indicative of broken growth prospects. Catalysts will be new client wins, analyst upgrades, LED pick-up, indicatons of increasing market share due to Japan disruption, advancement of CPV solar technology, margin preservation and expansion in the face of rising input costs.
Risks:
  • Wireless mobile, LED and terrestrial CPV solar markets are not in secular growth period.
  • LED softness in Q1'11 is more than seasonal correction and will be prolonged.
  • AXTI's JV ownership does not represent a strategic competitive advantage in its industry and are not hidden value.
  • JVs in raw material suppliers will not allow AXTI to control input cost inflation and gross margins reduce materially below the 35-40% indicated by management.
  • Transition to lower cost compound semi substrate technology.
  • Delays in capacity expansion leading to inability to deliver for clients.
  • Disruptions in Japan have a net short term negative effect on the company.
Company presentation is available here.
Disclosure: I am long AXTI.
This article is part of Seeking Alpha's daily coverage of Stocks & Sectors.

Thursday, March 17, 2011

Will DJIA Continue its Downward Move?

DJIA has just tumbled another 200 points today. It has tumbled more than 400 points in the last 3 days and more than 800 points for the last 18 days. It seems like it will keep tumbling down further and faster in the days to come. One of my regular visitors who successful predict this downtrend and he manage to make more than 50k betting on the S&P in just a matter of 2 days. Well good job to him!

Anyway, will this punishment for DJIA will continue and sent the market down further? Or will it stop from here and consolidate before going more downwards? 

After very deep studies and thinking on the above matter, I believe that it will be a "Yes" answer to both questions above. I am predicting that DJIA will correct a little bit before the extreme punishment will occured and send DJIA back to its 1 and very important support at 10,960. If DJIA fails to hold and breaks this level, then the next target DJIA is heading to is 9990 which is the second important support. 
 Click on the above image to enlarge

Click on the above image to enlarge

The above chart shows that DJIA is going down fiercely with very high volume compare to the avearge. It is an extremely bearish signal which should be taken note.

Both the MACD and Stochastic are currently showing that DJIA is currently in the middle of the downward trend, it has yet to meet the oversold signal. In other words, DJIA will tumble more before it hit the oversold indicator and rebound. 

Based on the above studies, I am very convince that DJIA will eventually hit the first support level at 10,960.  From there, we will then analyze the global market and then should decide further will DJIA will hit the 2nd support at 9,990. 

Monday, March 14, 2011

The Sinking of Japan! Will US be Next?

Japan have experienced the worst Tsunami ever on March 11, 2011. It has wiped of the entire city and claims thousand of lives. On March 14, Nikkei has sunk by more than 6% which is a multi year high drop in a single day.

Grab on those Japanese Balloons if you want to save your life!

Click on the above chart to enlarge

The very important question that all my loyal readers want to know is will US be next to sink? I am sad to announce the news that yes, indeed! US have already sunk on the 22nd February, 2011 with a long candlestick down which is extremely bearish.

The sinking of Japan has nothing to do with the entire world equity market showing bearish sign. In fact Japan has also sunk much earlier than that. If you look at the chart below, Nikkei has infact sunk on the 22nd Febraury, 2011.

Click on the above chart to enlarge

Coincidently both the MACD and Stochastic Indicators on both chart also indicates that the actual reversal of the bullish trend for the both chart actually happened on the Feb 22nd, 2011.

Another regular and loyal visitor to my chart Mr. Dp also agreed to my idea above. Please read our chat below starting from the very bottom.

Edmund: u will like it trust me
15 Mar 11, 12:51 AM
Edmund: i totally agree that is why i am going to post on this, please refer to my latest post in 10 minutes
15 Mar 11, 12:29 AM
dp: this trade has a 75% chance of making big $$ as well as other indicators also supporting this down direction right now.plus of course the quake ect
15 Mar 11, 12:27 AM
dp: that would be your stop , any close above 1294 once triggered
15 Mar 11, 12:26 AM
dp: the only rule if you take the short play is that if we get the close below 1294 and then it CLOSES ABOVE 1294 there after EXIT THE TRADE
15 Mar 11, 12:21 AM
Edmund: i think this market has nothing to do with the kamikaze earthquake
15 Mar 11, 12:20 AM
Edmund: hi dp, i agree with what you have said
15 Mar 11, 12:16 AM
dp: vs my target of 1256, if we CLOSE under 1294 today we are heading down so take a short on the close below 1294 and ride it for 40 s/p points lower . either use the bgz or the tza
15 Mar 11, 12:13 AM
dp: ed i willmake this statement. this eartquake has nothing to do with the market going down. the decline started at 1344 14 days ago. what might happen though is we can go to 1180=1220 due to thequake
14 Mar 11, 11:22 PM
dp: remember the CLOSE not the intra day low
13 Mar 11, 12:44 AM
RT: However - market seems to do the un-thinkable hence why I am cash right now, waiting for direction. The action on Thursday could have been a bear trap
13 Mar 11, 12:43 AM
RT: Meant to say- "I think the market top MAY be 1360-1370"
13 Mar 11, 12:42 AM
RT: DP - I like your thinking. I tend to agree. Either way, I think the market top is 1360-1370, for now. With earnings season around corner, i could see us getting up there
12 Mar 11, 11:39 PM
dp: i would start layering in shorts at 1313 with final short at 1323 if we get there. your STOP is 1333. take the CLOSE above 1333 long for a target to 1365 or take the CLOSE below 1294 to 1256 im short
12 Mar 11, 11:30 PM
RT: Looks like we get a bounce on Monday. I am not sure how far this goes, but I expect to 1318-1320

Tuesday, March 8, 2011

US will Attack Libya and the Oil Price will Tumble!

Yesterday, I was looking at the NASDAQ stocks which tumble heavily. The first thing that comes to mind is will US interrupt in this war? If yes, what kind of soldiers will US sent to fight in this war? Kindly refer to the above picture for the answer.

Anyway, lets cut the bullshit. The reason I am posting the above heading is to get your attention. The real creme de la creme of this post is the analysis below on where are DJIA and NASDAQ heading to from here.


Click on the above image to enlarge
Based on the current technical indicators, DJIA is looking to find the first support at 11,000. The political unrest in the middle east is only the excuses for the reason sell down. DJIA is currently very overheating and it needs a catalyst or reason for it to consolidates. The reason political unrest in Libya will be the perfect reason. Both the MACD and Stochastic indicate that DJIA will continue to consolidate lower and tumble down further.
Click on the above image to enlarge

The Nasdaq Composite is also heading towards the important support at 2,460. Nasdaq has been experiencing upward move from 1,268 in Sept 3, 2010 to the current level of 2,745. That is an increased of more than 115%. I think it is about time for Nasdaq to consolidate down seriously before any upward move to continue. It is also a good reason to flush out all the weak holders and those contra players. Both the MACD and Stochastic indicate that Nasdaq Composite current downturn is just the beginning, it still has long way to go before both the indicators show oversold position. 

Based on the above analysis, I would summarize that the recent political turmoil in the middle east is just and valuable and good excuses for the stock operators to swap the position from going long to short. I believe it is just the beginning of their move and more downward punishment for stocks that gained tremendously in the recent term will continue. 

For those who wants to go long, may the force be with you.

Saturday, March 5, 2011

Am I in the Danger Zone?

Click on the above image to enlarge

I am in a big dilemma now. This is a serious issue here that I am facing. I have bought about $90,000 worth of stock in Axt Inc. and now the stock is not performing as per my expectation. So what should I do now? Should I sell, hold, or run for my life. My entry price for this stock is $7.20.

Once again my experience in chart reading will be very useful as this point in time. The chart shows that AXT Inc is currently consolidating after a huge downward move of this stock. This current volumes indicate that the chart is consolidating with very low volume. It may be the selling is now fully absorbed or the buyer is not buying the stock to push it upward.

The MACD histogram indicates that it is moving upwards toward the center line and perhaps above it. The MACD blue line also shows the curve that it is about to move up to the red line and above.

The RSI clearly indicates that this stock is very much oversold.

The stochastic indicator also shows that the current downtrend is about to change its course. Both the blue and red line below the 20% threshold indicates that this stock is very much oversold. The blue line is also about to cross over to the above the red line, which shows some bullishness in this stock currently.

Based on my above technical analysis on this stock, I would rate it a superb buy. However, I am not god, I cannot be 100% accurate in my prediction on what will happen next for this stock. However, I am praying that my analysis is correct otherwise I will lose some big money in this bet.

There is also high chances that this stock will tumble further after this current brief consolidation. I just hope that it won't happened cause I really can't afford to lose again. Lets all put our hand together and pray for the o' mighty god. Amen.

Saturday, February 26, 2011

Micron Technology, Inc. The Three Stooges?

 The Three Stooges/ Founders of Micron Technology?

While surfing at the top 10 volume of the Nasdaq, I notice one interesting stock that stands out among the rest. I decided to do some studies about it on this stock and it is none other than Micron Technology.
While surfing for more info on this stock, the above picture came out and it mentions that the 3 person above are the founder of Micron Technology. I dont know whether it is real of fake because the 3 persons look like 3 stooges to me. That is how the heading came about.

Another picture that came out while surfing for Micron Technology is the young beautiful chinese lady above which is the promoter of one of the Technology Road Show in Asia. Nice Body!


 Click on the above image to enlarge

Looking at the long term chart, this chart shows that Micron Technology is currently in the range bound trading of between $11.50 and $6.80. Micron is currently testing the very strong resistance at $11.80 and it has failed to overcome it.

Both the MACD and stochastic do not show any recovery or upward signal. Instead, it shows that more consolidation is about to come and bring this stock lower.

 Click on the above image to enlarge

The short term chart shows that this stock might be heading lower to test the 1st support at around $9.40. Although the last 2 candlesticks that show a positive signal, I am not convinced because of the low volume and also the 2 important bearish technical signals which is MACD and stochastic.

The recent 2 up candlesticks may be the work of traders trying to cover back the short position which was aggressively carried out for the past 1 week.

The last 2 candlestick also shows that a candle which is almost simliar to the bullish engulfing pattern, however, I am still not convince this is the change of a recent downward trend, however, I believe this is merely a very short term correction.
What Does Bullish Engulfing Pattern Mean?A chart pattern that forms when a small black candlestick is followed by a large white candlestick that completely eclipses or "engulfs" the previous day's candlestick. The shadows or tails of the small candlestick are short, which enables the body of the large candlestick to cover the entire candlestick from the previous day. (http://www.investopedia.com)
Looking at the chart, my analysis and sixth sense are telling me that the recent downtrend is just the beginning. More punishment will come for this stock going forward.

Based on the fundamental analysis, Micron recently announced  the 1st quarter EPS of $0.15 which is very much below the analysts concensus of $0.28. This recent earning is a whopping 40% below the estimates. Now it really gives a reason for the continuos punishment of this stock.

Conclusion:
Based on the long and short term technical analysis, the fundamental analysis and my sixth sense, I believe this stock will continues to head downward after a 2 days of weak correction. Therefore, my recommendation is to go short for this stock for the near future.

I currently do not own any stock in Micron and I do not to enter any position in this stock as I am currently heavily invested in AXT Incorporated.

==================================================
Disclaimer : This is not an investment advisory, and should not be used to make investment decisions. Information in The Market Oracle Blog is often opinionated and should be considered for information purposes only. No stock exchange anywhere has approved or disapproved of the information contained herein. There is no express or implied solicitation to buy or sell securities. The charts provided here are not meant for investment purposes and only serve as technical examples. Don't consider buying or selling any stock without conducting your own due diligence. 
==================================================

Friday, February 25, 2011

Can you Trust This Chinese Company? AXT Inc.


Today stock pick is a chinese company listed in Nasdaq.This growing company is non other than AXT Inc. Can this chinese company can be attactive as per the chinese model above. Maybe....


 Click on the above image to enlarge

As usual my analysis will begin with the chart. The chart of AXT shows that this stock has dropped from the recent high of $12 to the current level of about $7. This is a whopping 40% drop in less than 2 weeks. I believe that this stock is ready to move upward due to the short covering by the speculators and also the attractiveness of this stock at the current level.

Technically, this chart shows an oversold position as per the MACD and stochastic. The recent downward gap with huge volume also indicated that there is a big changes in the stock ownvership from the seller to the buyer. I believe all the selling on this stock has been conmpletely absorbed by the buyer and no more selling for the coming near terms.

The chart also indicate that this stock might be heading for a good rebound up to the $9 level which is the 1st resistance. If this stock can break the $9, I will do another stock analysis for this stock again.

I have recently bought a whopping 12,000 stock in AXTI due to the bullish harami pattern. Please refer to below for the explanation for bullish harami. AXTI clearly shows a bullish harami pattern and it manage to convince me to jump into this stock. And true enough, after I took my position in this stock, it end the day with a 3% gain from my average entry price of $7.23.
Conclusion:

I am very convinced that this stock will head to the $9 level for at least a 20% gain. I also believe that the recent sell down in this stock is very much overdone and also it is definetely the work of the stock operator who go short on this stock. I think that it is time for the stock operator to cover their position in this stock which inevitably will help to push this stock higher.

AXTI is a seasonal stock which the price of this stock can fluctuate greatly. Now is definetely the time to go long on this stock for the coming near future, as the overall US economy is poised for a serious rebound.

What Does Bullish Harami Mean?
A candlestick chart pattern in which a large candlestick is followed by a smaller candlestick whose body is located within the vertical range of the larger body. In terms of candlestick colors, the bullish harami is a downtrend of negative-colored (black) candlesticks engulfing a small positive (white) candlestick, giving a sign of a reversal of the downward trend.

Investopedia explains Bullish Harami
Because the bullish harami indicates that the falling trend (bearish trend) may be reversing, it signals that it's a good time to enter into a long position. The smaller the second (white)  candlestick, the more likely the reversal.


AXTI has recently announced an earning per share of $0.15 which is 1 cents below the analyst estimates. I believe that the selling panic over this stock has been overdone, as I believe that the earning per share for this stock will continue to grow in the coming quarters, although the next quarter estimates will be lower than analysis estimates.

==================================================
Disclaimer : This is not an investment advisory, and should not be used to make investment decisions. Information in The Market Oracle Blog is often opinionated and should be considered for information purposes only. No stock exchange anywhere has approved or disapproved of the information contained herein. There is no express or implied solicitation to buy or sell securities. The charts provided here are not meant for investment purposes and only serve as technical examples. Don't consider buying or selling any stock without conducting your own due diligence. 
==================================================

AXT and CalAmp: Two New Picks for 2011

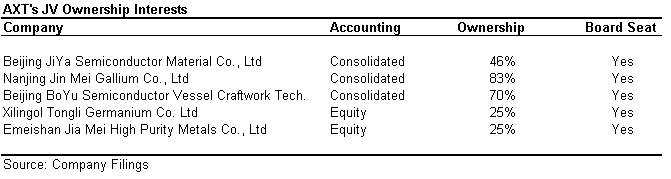
AXT designs, develops, manufactures and distributes high-performance compound and single element semiconductor substrates comprising gallium arsenide (GaAs), indium phosphide (InP) and germanium (Ge) through its manufacturing facilities in Beijing, China. In addition, AXT maintains its sales, administration and customer service functions at its headquarters in Fremont, California. The company's substrate products are used primarily in lighting display applications, wireless communications, fiber optic communications and solar cell. Its vertical gradient freeze (VGF) technique for manufacturing semiconductor substrates provides significant benefits over other methods and enabled AXT to become a leading manufacturer of such substrates. AXT has manufacturing facilities in China and invests in five joint ventures producing raw materials.
The company experienced rapid growth during the internet "boom" years from 1998 to 2000, with sales growing steadily from $49 million in 1998 to $121.5 million in 2000. Thereafter, annual sales spiraled downward and bottomed out at $26.5 million in 2005. Large losses were recorded in each year from 2002 through 2005. Thereafter, operating results improved, with sales climbing each year until peaking at $73.1 million in 2008, and then falling back down to $55.4 million 2009.
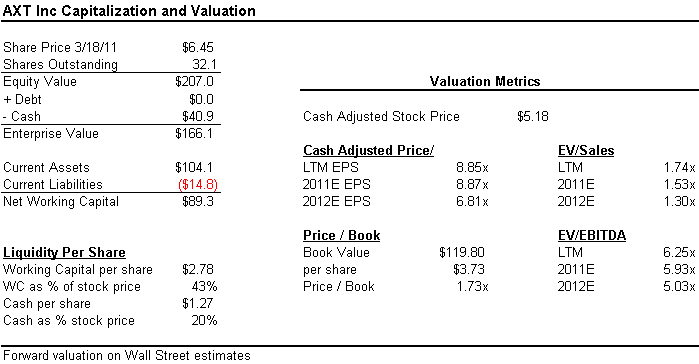
Quarterly sales bottomed out in the first quarter of 2009 (low point of the recession) at $7.7 million, and have increased sequentially in each quarter thereafter, and totaled $26.8 million by the third quarter in 2010. The company returned to profitability in the third quarter of 2009 and net income has been growing with sales. Analysts are forecasting sales of $97.5 million for 2010 and $123.9 million for 2011. Current earnings per share estimates call for $0.60 in 2010 and $0.70 in 2011, which are up from small losses in the years 2008 (-$0.03) and 2009 (-$0.06). Generally, analysts having been raising their forecasts and management has been increasing its guidance in recent quarters. The company has a solid balance sheet with cash and equivalents of $41 million, total liabilities of just $12.6 million, and shareholder equity of $113 million at September 30, 2010.
With total diluted shares outstanding of about 32.5 million shares the current market cap is around $340 million. Operating margins have improved nicely after the first quarter in 2009. See our summary worksheet for AXT Inc. showing fundamentals and metrics for the 5 calendar years 2005-2009, and the first three quarters in 2010.
Besides a much stronger economy, the company appears to be benefiting from a number of managerial changes made in 2009: including the Board appointing Dr. Morris S. Young as the chief executive officer replacing Dr. Philip C.S. Yin, who resigned as chairman of the Board and chief executive officer on March 17, 2009. Additional executive changes were made in 2009 and continuing to date, including the termination of the Vice President of Global Sales and Marketing on December 31, 2010, “as a result of a change in the organizational structure of the company and the elimination of that position with the company”.
Recently, the stock price reached a multi year high and closed at $10.46 on January 7, 2011, which is near the high end of its 52 week range of $10.74 - $2.65. We established our long position from October 29 through November 30, 2010 at an average cost of $8.08. We would look to buy more shares if the stock pulls back to the $8.00 to $8.50 range. My target price for AXTI is currently $15 sometime in 2011, but this can be revised depending on the company’s future operating results.
A potential negative is that Bookings for Semiconductor Equipment Manufacturers, while still healthy, have been trending down in recent months (October & November 2010) from the highs reached in the months of July and August 2010, as reflected in the chart below:
January 12, 2011SeekingAlpha
------------------------------------------------------------------------------

AXTBy taking advantage of the current tech boom and the resulting increased demand for its materials, semiconductor substrate producer AXT has benefitted from rising sales and profits. It's outpacing the efforts even of TriQuint Semiconductor (Nasdaq: TQNT), a notable outperformer that is riding the coattails of the iPad's popularity. In its latest quarter, sales at AXT were up 60% while profits doubled as smartphones and other intelligent wireless devices drove growth, helping some CAPS members decide that this was one hot stock.
With AXT's stock having tripled over the past year, CAPS member LoveMeSomeGreen says investors shouldn't worry about it going higher still.
Don't fear these stocks with big gains this year! Look at AXTI from the April highs thru today. The markets have gone practically nowhere, and these guys have managed solid revenue growth in this slow growth environment. Last time I checked, that was a good thing. This stock was trading at 25 p/e until these two back to back monster quarters. This is a still a golden pony.
Adding AXT to your watchlist allows you to stay on top of all the timely Foolish news and analysis.

Stock
CAPS Rating Sept. 7
CAPS Rating Dec. 7
Trailing
4-Week Performance
P/E Ratio
AXT (Nasdaq: AXTI)
**
***
7%
17.0


December 08, 2010The Motley Fool
----------------------------------------------------------------------------

Wednesday, February 23, 2011

DJIA Will Now Tumble to 11,000. Can you handle this?

Is this current downturn in the world stocks market is due to the Libya civil war. The answer is yes and no, but it is more towards the no side.

The answer is yes because it is true that the current Libya civil war is bringing up the price of the oil, however, I do not see the oil price supplies will be substantially affected due to this. This is mainly a speculation and the work of the oil operators to push up the oil price for their own personal gain. Libya is the 15 world tops oil producer, unless Libya is no.1, then it will have a very high impact on the supply of the oil price. However, the oil operators is taking this reason of the civil war to push up the oil price and it indirectly does have the effect on the world stock market.

The answer is no because it is time for DJIA to tumble and to consolidate as it is very much overdue.
Based on the my latest technical analysis on DJIA, I am predicting that it will crash to the 11,000 level. The probability of it happen is very high because the recent upward surge in DJIA is overdone and overprice. It is only fair that DJIA must consolidate back to this level for a fair game. Otherwise, it looks really fake for DJIA to continue to go up without stopping and resting. Imagine, you start running from California State all the way to New York without stopping, can you handle it? DJIA, in this case, can't handle the pressure of its superb upward move.

I am unstoppable and I am going to eat DJIA alive!

Monday, February 21, 2011

This Product by Finnish is Finished.

This product is none other than Nokia. Nokia is from Finland and it is a Finnish's Company. However, I believe that this company by the Finnish is finished. The reason is simple, Nokia is not able to keep up with the new generation of the smart phone. Nokia has been producing shitty phone which were not able to compete with the likes of Apple and Samsung.

Click on the above image to enlarge

Based on the long term chart, Nokia has been tumbling from the $40 to the current level of $9.00. It explains why the CEO of Nokia has been sacked recently. And I think the board has made a good decision to change the CEO. Anyway, back to the technical analysis. I believe Nokia is currently trading between the range of $12 to $9. However, I believe that in the coming future, Nokia has a high probability to head below the $9 level after few months on consolidation under the current range.

Click on the above image to enlarge

Based on the short term technical chart analysis, Nokia has just been punished with a big downward gap coupled with high volume. It is a very bearish signal. After the recent downward gap, Nokia try to consolidate upward, however, the buying is not enough to push the stock higher to cover the upward gap as evident by the declining volume. The declining volume shows that the bull is very weak in their effort to push Nokia higher. I believe it is just a matter of weeks before, the bear come dominating the bull again and send Nokia to break the long term support of $8.00. Although, both the MACD and Stochastic look oversold, however I am still not buying it as I believe that this company has not been fully punished yet. More punishment will prevail for this under perform company.

Looking at the recent quarterly earning announcement, I am surprised to see that Nokia reported an earning per share of $0.30 which is a great improvement from the previous quarter of $0.14. It shows that Nokia has actually show some improvement. I do not know how Nokia reported such a solid earning and from where the earning actually came from, because everywhere I go, I did not longer see any Nokia phone around, it is now dominating by I-Phone.

Based on my analysis and research as per the above, I would recommend a short position on this stock. I am predicting that Nokia will continue its market share in the phone industry and resume its downward trend, perhaps, to the $5 level and below.

==================================================
Disclaimer : This is not an investment advisory, and should not be used to make investment decisions. Information in The Market Oracle Blog is often opinionated and should be considered for information purposes only. No stock exchange anywhere has approved or disapproved of the information contained herein. There is no express or implied solicitation to buy or sell securities. The charts provided here are not meant for investment purposes and only serve as technical examples. Don't consider buying or selling any stock without conducting your own due diligence. 
==================================================

Sunday, February 20, 2011

I will Shut Down My Blog if ....

 
Above chart is an example of a chart which 90% resemble to the Atmel Corporation chart during the consolidation period as per below. The chart above as per the highlighted boxes show the indications of the continual upward trend for this stock.

Click on the above image to enlarge

Yes, the above heading is correct, I promise all my reader here that I will shut down this blog which I have give in my 100% effort to help my fellow visitors here to make good money if I am wrong about my investment in Atmel. I am currently heavy invested in Atmel and I am down by around 4%.
If Atmel touches my stop loss and also broke the uptrend range line at $15.00 or if I lost more than 10%, then I will shut down this blog.

The reason I am doing this is because I would like to maintain a good reputation and also the accuracy of my prediction.

I am confidence that Atmel will continue its upward trend because:
1) the upward range line is not broken
2) the reducing volume indicates that the selling is over or fully absorbed by the buyer
3) the recent upward surge with a big gap and big volume is a good sign that powerful buying force is behind the upward move
4) the MACD indicator shows that the consolidation is over and now it is ready to resume its upward trend
5) the increasing quarterly earning that continue to beat analyst estimates for the 2 consecutive quarters.
6) my sixth sense

Will the World Greatest Mining Company Resumes its Upward Move?

 Well, another billion $ question. A regular visitor to The Market Oracle would like to seek some advise on one of the world greatest mining company Freeport Mcmoran Copper and Gold (FCX) whether the current run up will continue or is this giant going to tumble.

Click on the above image to enlarge

Well, as usual my technical analysis will begin with the long term chart. It appears this giant FTX has met the the Great Wall of Mining which is at $61. This level is also the multiyear resistance which is very hard to be broken. True enough, after it flirted with the $61 level, it begins to tumble badly.
Click on the above image to enlarge

Based on the short term chart analysis, which I think is more important than the long term chart, it shows that this giant FCX will head to the 1st support at $48. If I were to rate the possibility of it happened, I would say that I am 80% sure. In other words, it is 80% out of 100% that it is heading to the $48 level.

Both MACD and Stochastic show that this chart willl continue to tumble until these technical indicators finds the resting area below which is towards the lower side. Until then, it will not rebound and head further upward.

As can be seen from every one of the huge downward candle, it tumble with higher volume than the volume of the upward candle. It clearly means that the bear is clearly dominating the bull.

Also the upward trend line is currently clearly broken.

Click on the above image to enlarge

Based on this very simple and clear fundamental analysis, the quaterly earning shown an upward trend, the latest quarterly earning also successfully beat the analyst estimates.

Based on this strong improvement in the quaterly earning, this is one and only reason I will say that this stock will rebound after touching the 1st support at $48.

It is also a good reason for the stock operators to push the stocks downward and to clear the weak holders before it resumes its upward trend.

Whether or not this stock will rebound and move upward is a big question that is difficult to answer, however, to test the technical support of $48, I am very sure that it will definetely happen.

==================================================
Disclaimer : This is not an investment advisory, and should not be used to make investment decisions. Information in The Market Oracle Blog is often opinionated and should be considered for information purposes only. No stock exchange anywhere has approved or disapproved of the information contained herein. There is no express or implied solicitation to buy or sell securities. The charts provided here are not meant for investment purposes and only serve as technical examples. Don't consider buying or selling any stock without conducting your own due diligence. 
==================================================

Wednesday, February 16, 2011

Will All Upside Gap Be Filled?


A Picture of a Nice River Gap in Between

Click on the above image to enlarge 
I have recently bought 7,000 stocks in Atmel Corporation at $16.40. I have dump almost all my savings worth around 100K ($25$ was taken out of my account to clear my off my housing loan) in this stock. The price of Atmel is now trading at $15.84 and  I have lost more than 3% as of today. Do I regret it?
Yes and No. Yes, because I should have bought at the current price of $15.84 and lower. No, because this stock can resume its superb upward move anytime and I may miss this bullet train. Whatever it is, it is all history cause I have already invested in it and all I can do now is to sit tight and wait.

However, I chooose not to sit tight and wait cause this is my life saving in here that I am betting on. I decided to ask myself a very important question which is, will the recent run up gap in Atmel be filled? If Atmel were to fill back the recent upward gap to $15.00 then I will lose more than 10% from the level that I have bought.
Although I believe there is always the possibility, but I believe that the probability is low.

I have seen more than few thousand charts during my last 13 years of trading the stock markets, some get filled and some dont. I believe in this case, Atmel recent run up gap will not be filled.

The reason is simple, the recent upward gap in Atmel is supported by the monstrous earning which they have reported in the latest quarter. Analyst from all over were upgrading this stock and raise its target price and earnings estimates. Moreover, the recent craze into the touch screen products have not ended. Indeed, some believe that this is the only beginning of more innovative touch screen products to be unveiled. People are all crazy about touch screen products now. Just look around you and the gadget the people are carrying, I be that 1 in every 3 person is carrying a touch screen product, whether is a phone, a MPS player, a Tablet or in the coming future, notebook will have touch screen on it.

This is truly a madness for this technology and Atmel is truly a montsrous ready to roar!

Click on the above image to enlarge

If you look at the above chart for Crus, you can see that there are actually 2 upward gaps which have not been fillled. Once Crus have the first run up gap, it consolidated on the upper gap level until it is ready to rocket further. Same goes to the second upward gap, it is also not filled and this stock continue to roar forward ahead.

I believe that the current consolidation above the gap is Atmel is a very good sign, as long as it does not come down to fill the gap at $15.00, this stock have a 90% chances to power ahead. If it does come down to the $15.00 and go below, then this stock should be sold as further downtrend is expected. In other words, the stop loss should be at the $14.50 level to be accurately confirmed.

However, based on my experience and my sixth sense, I believe that this stock will continue to consolidate at the upper side of the gap and above the $15.70 level and once it has consolidates and flush out the weak holder, this stock will definetely resumes it upward trend. Moreover, any good news or analyst upgrade on this stock will easily serve as a catalyst for this stock to resume it upward run. Somehow, it happens many time that usually before the stock resume its upward move, good news or upgrade will suddenly pop up. Is it a coincidence or stock manipulation? I don't know the answer to it, you will have to figure it yourself, but I believe the stock operator will know this answer very well.

I believe now is a very good time to catch this train if you are currently not riding on it. Once the train start moving, you will be able to catch it unless you willing to pay higher for the train ticket at the next station.

Good luck and happy investing!

==================================================
Disclaimer : This is not an investment advisory, and should not be used to make investment decisions. Information in The Market Oracle Blog is often opinionated and should be considered for information purposes only. No stock exchange anywhere has approved or disapproved of the information contained herein. There is no express or implied solicitation to buy or sell securities. The charts provided here are not meant for investment purposes and only serve as technical examples. Don't consider buying or selling any stock without conducting your own due diligence. 
==================================================

Monday, February 14, 2011

The Future is Atmel Corporation

Click on the above Image to Enlarge
This stock has been consolidating for 3 straight days, the more it consolidates, the more this stock is waiting like a rocket ready to thunder upward. Although it seems like it is in an overbought position, but 3 days of consolidation were not able to bring this stock down, instead it remains strong and calm while in the consolidation mode. I believe the time is ripe for this stock to thunder ahead and reach $20 level within 2 weeks time and probably, $50 within a year. As long as touch screen is the future, Atmel will be our future.

Yesterday night, I only slept for 3 hours, my head feels a little dizzy and headache right now, do I regretted it? The answer is a big no. I am very happy cause I have spent more than 6 hours of my sleeping time researching for a stock which will help me reach my target of $1 million. I think I have finally found it. It is none other than Atmel. I am still very blur and dizzy while typing on this blog and sharing this very good news to my loyal visitors to my blog. I hope the info posted here will help you gain at least 50% and above. I, on the other hand is hoping for a 100% gain.

I have researched almost 50% of the stocks in NYSE and NASDAQ yesterday night and Atmel is my top pick and also my 1 and only pick.

So why did I pick this stock? The answer is simple, because it is my future and our future. The analogy is simple, Touch Screen is the future, Atmel is the future because it supplies the technology for touchscreen, The Market Oracle is the future because it highly recommends a buy on Atmel, and I am the future because I am heavily invested in Atmel and I will make more than 100% gain riding on this future technology provider company - Atmel. This will be our future because I sharing this wonderful and important research on this superb stock with you all here.


This stock has delivered 2 powerful quarterly earning that beat the serious shit out of the analysts estimate. I believe this is not it, there will be more even thunderous earning that will be announced by Atmel in the coming quarter. This time it will not only beat the analysts estimate, but I believe, it might put the analysts who covered this stock out of their job and send them straight to their grave for not giving a respectful earning estimates for Atmel.

In future, more than 80% of our products will have touch screen on it, there won't be anymore button for you to push. You just need to touch. And you can be assured that Atmel will be there to supply this technology.


"Atmel® touch innovation, maXTouch™ is the next-generation controller technology for touchscreen applications that delivers both superior performance and low power consumption. The technology enables touch interfaces that identify, qualify, and track the user’s contacts with exceptional precision and sensitivity. With maXTouch unlimited touch, users can enjoy a sophisticated interface that is smart enough to ignore unintended touches. Atmel touchscreen chips are small enough to fit the most compact mobile devices and powerful enough to accommodate the larger screens on products such as digital tablets. The result: peerless touch interfaces that are intuitive, flexible, reliable, and battery-friendly".
==================================================
Disclaimer : This is not an investment advisory, and should not be used to make investment decisions. Information in The Market Oracle Blog is often opinionated and should be considered for information purposes only. No stock exchange anywhere has approved or disapproved of the information contained herein. There is no express or implied solicitation to buy or sell securities. The charts provided here are not meant for investment purposes and only serve as technical examples. Don't consider buying or selling any stock without conducting your own due diligence. 
==================================================


Related Posts Plugin for WordPress, Blogger...