Friday, December 31, 2010

Level 3 Communications - Not for the Faint Hearted

Yesterday while I was browsing through the top volume stocks in NASDAQ market, I happened to see this nicely set up chart which I think is due for a rebound. This stock is none other than Level 3 Communications (LVLT).

 Based on the long term view, the recent down trend line has been broken. It looks like it may head up to the 1st resistance of $1.8 level.

Based on the short term chart, LVLT convincingly broke the down trend line with a bang with very heavy volume and a big gap up. After that, this stock heads a little down for a short term consolidation. Looking at the decreasing volume, it suggest that the selling might be over and the consolidation for the recent upward move appears to be over.

Both the MACD and Stochastic indicate a positive sign for this stock. The MACD histogram appears to be moving towards the middle line into the top. As per the MACD line, the blue line is now touching the red line and it appears that the blue line will go on top anytime.

The stochastic looks strong and it has not yet reach the overbought level which is above the 80% level. It looks like this stock will definetely go up in the next few days.

Based on the technical sides, this stock is definetely a big buy for me.

Lets look at the fundamental side:
The past five quarter earning do not look good at all.
Q3, 2009 = -0.10
Q4, 2009 = -0.11
Q1, 2010 = -0.14
Q2, 2010 = -0.10
Q3, 2010 = -0.10

Going into the future, the estimates earning do not look good as well. Many analysts give a estimate of -0.10 for the coming new few quarters.

Based on this quarterly earning report for the past and the future earnings, I do not intend to go further on my research as I believe this is a waste of time, this stock do not past my 1st criteria as a good fundamental stock.

Therefore, fundamentally this stock is not a buy.

Based on the simple technical and fundamental analysis that I have done above, I would say that this stock is definetely for the daredevil and not the faint hearted. However, if you would like to try, kindly make sure that you put a stop loss whereby if these stock go down to $0.90 from the curent $0.97, you should sell immediately instead of letting the stock goes down further and burn away your hard earned money.

Good luck! and Happy New Year!
=====================================================
Disclaimer : This is not an investment advisory, and should not be used to make investment decisions. Information in The Market Oracle Blog is often opinionated and should be considered for information purposes only. No stock exchange anywhere has approved or disapproved of the information contained herein. There is no express or implied solicitation to buy or sell securities. The charts provided here are not meant for investment purposes and only serve as technical examples. Don't consider buying or selling any stock without conducting your own due diligence. 

Happy New Year 2011

Every year goes by very fast. It is like a blink on an eye. If we look back at the past 1 year, do I really accomplish anything? I definetely not. I am not doing really well for the year of 2010. It is like a punishment and learning year for me.

However, for this year 2011, I would like to see a new beginning not only for my blog, but for my investment in the stock market as well. I hope that this year, not only I will achieve my target of $1million, but at the same time, I hope to donate more to help the needy and also bring to the readers of my blog, my knowledge and experience, to the journey of reaching $1million.

I pledge to donate more, if I ever achieved this goal and I hope that all my readers of my blog can benefit as well.

Last but not least, I would like to wish a very Happy New Year to everybody and may all your dream and your goal in life will come true and thank you for your visit to my blog which makes this blog lively.

Wednesday, December 29, 2010

What Now for Supervalu? Buy, Hold or Sell?


I have invested half of my capital in this stock at $9.16. So after more than a week, the big question is what now? Will the stock continue to go up from here after a small gain to $9.26 or will Supervalu continue its downward trend? Is Supervalu is really super value now? Well, I hope my technical analysis skill that I have acquired for more than 10 years will help me answer this question. 

I will not analyze this stock based on A-E section that I have indicated on the above chart.

A- Based on the candlestick indicator, it is currently showing a positive outlook. I believe that within 2-3 days more, this stock will shot up with at least a 3% gain.

B- After a small climb from the $8.80 level, the stock now is consolidating at the $9.20 level. The decreasing in volume show that after this small run up, the selling has been well absorbed for the next upward surge. It shows that they are no more selling or has been reduced an the operators is slowly and quietly accumulating the stock for the next upward surge.

C- The MACD histogram show a slight negative indication because the last bar is red, therefore, it is not a good sign. However, I believe that this is only a very small indication on the downside which does carry any weight.

D- As per the MACD line, the blue line is still very much on top of the red line, as long as the blue line is on top putting pressure on the red line, I can definitely sleep well at night and hold on to my darling - Supervalu.

E- Stochastic indicator is now showing a 50-50 indication on whether this stock will move up or down. The blue line is currently touching the red line and it is quite worrying for me actually. Stochastic indicator is a powerful indicator to detect the shift of trend line. I rely on this indicator quite often. As for the current status, I don't have a clue what will happen cause it is currently at the 50-50 cross road.

Based on the above analysis, I am very confidence that Supervalu will continue its upward move within these few days. However, if I am wrong, I will not hesitate to chop off this stock from my portfolio at once. Even thought I believe that the percentage gain for this stock can be 3-4 times more than fundamental stock like Cisco, Supervalu is still a risky stock with very high debt. Therefore, this is a stock that I will take immediate action once I think it is failing me.

As for Cisco, which I have parked my other half of my capital in this stock, I will continue to hold until I have realize at least a 10% gain, no matter what the short term move for this stock is.

=============================================================
Disclaimer : This is not an investment advisory, and should not be used to make investment decisions. Information in The Market Oracle Blog is often opinionated and should be considered for information purposes only. No stock exchange anywhere has approved or disapproved of the information contained herein. There is no express or implied solicitation to buy or sell securities. The charts provided here are not meant for investment purposes and only serve as technical examples. Don't consider buying or selling any stock without conducting your own due diligence. 

Monday, December 27, 2010

US Airways Group a Hold or a Sell?

A regular visitor to my blog and now a friend ask me whether it is a sell or hold for US Airways Group (LCC). She has bought it at $10.42 and now is trading at $9.90. Although it is just a small losses, however, small losses can turn into big losses in a short time, therefore, swift action must be taken to ensure that losses is kept to the minimum.

Lets look at the technical part and then we shall look at the fundamental side.

Looking at the long term chart, this stock is currently trading at an upward channel line. However, looking at the decreasing volume, it shows that the buying or support for this stock is losing momentum. As per the MACD and the Stochastic Indicators, both indicated a downward move for this stock in the near future.

As for the short term chart, it shows that this stock might be heading towards the 1st support line at around $9 and if it breaks through, I will not be suprised that it will head down to the $7 level. On the last candlestick pattern, it show a bearish engulfing pattern which is bearish.

As per the technical analysis above, I will sell this stock.

As for the fundamental analysis, the past 4 quarterly earning and the next 2 quarters estimate are as follows :
Q4 2009 = $-0.20
Q1 2010 = $-0.55
Q2 2010 = $1.34
Q3 2010 = $1.23
Q4 2010 = $0.05
Q1 2011 = $-0.40

As can be seen from the above quarterly earning, it fluctuate substantially. It is not stable. This is not the kind of stocks that fits into my investment portfolio.

Although this stock is trading at a very low PE ratio at around 4.69, it does not mean that this stock will move upward. Sometimes stock trade at low PE ratio because the investor know that the value of the company is not attractive going forward.

Moreover, this stock does not issue dividend.

As a conclusion, this is not the type of stock that I am looking to buy or hold unless it is trading at $2-$3 when it is in the middle of year 2009.

However, please note that my analysis is not 100% correct, therefore, you need to decide based on your own judgement.

Below are the recent news on this stock:

=============================================

Citigroup (NYSE: C) Analysts Begin Coverage on US Airways Group, Inc. (NYSE: LCC)
December 18th, 2010

Citigroup (NYSE: C) research analysts began coverage for shares of US Airways Group, Inc. (NYSE: LCC) in a research note issued to investors on Wednesday. They set a “hold” rating and a $12.50 price target on the company’s stock. The analysts noted that the move was a result of a valuation call.

US Airways Group, Inc. (NYSE: LCC)’s stock traded down 0.69% on Friday, hitting $10.06. US Airways Group, Inc. has a 52 week range of $4.32 to $12.26. The stock’s 50-day moving average is $11.07 and its 200-day moving average is $9.89. Analysts predict on average that US Airways Group, Inc. will post $-0.40 earnings per share next quarter. The company has a market cap of $1.625 billion and a P/E (price-to-earnings ratio) of 4.69.

About US Airways Group, Inc. (NYSE: LCC)
US Airways, Inc. (US Airways) is engaged in the operation of a network air carrier. The Company provides air transportation for passengers and cargo. US Airways is a wholly owned subsidiary of US Airways Group, Inc. (US Airways Group). US Airways is a member of the Star Alliance, the airline alliance, which has 26 member airlines serving approximately 1,077 destinations in 175 countries as of December 31, 2009. US Airways has hubs in Charlotte, Philadelphia and Phoenix and a focus city at Ronald Reagan Washington National Airport. US Airways offers scheduled passenger service on approximately 3,000 flights daily to approximately 190 communities in the United States, Canada, Mexico, Europe, the Middle East, the Caribbean, Central and South America.

=====================================================

Disclaimer : This is not an investment advisory, and should not be used to make investment decisions. Information in The Market Oracle Blog is often opinionated and should be considered for information purposes only. No stock exchange anywhere has approved or disapproved of the information contained herein. There is no express or implied solicitation to buy or sell securities. The charts provided here are not meant for investment purposes and only serve as technical examples. Don't consider buying or selling any stock without conducting your own due diligence. 

Saturday, December 25, 2010

The Best Dividend Stocks

I have recently came across this article from a recommendation of a friend. This is an interesting article that I would like to share with everyone here. It mentioned that you can actually get an overall yield of 4% and cash a dividend check every month of the year from these 3 stocks: - Philip Morris International (PM), Bristol-Myers Squibb (BMY), and Intel (INTC).

The details of the article is as per below:

Monthly dividends from a 3-stock portfolio
by Chuck Carlson, editor DRIP Investor

DRIP investors typically reinvest dividends. However, my guess is that many will eventually need to start taking dividends to supplement other forms of cash flow.

And you’d like to receive those dividends on a regular basis. And, in fact, you can get monthly dividend check from a portfolio holding just three stocks.

True, most companies pay dividends either quarterly or semiannually.

Still, with some homework and planning, it is possible to turn that quarterly event into a monthly one by owning a basket of stocks that pay dividends during different months of the year.

For investors especially focused on current yield, Philip Morris International (PM), Bristol-Myers Squibb (BMY), and Intel (INTC) have special appeal.

Intel yields over 3%, and Bristol-Myers Squibb and Philip Morris International have yields well over 4%.

I would expect the companies to boost dividends over the next 12 months.

Philip Morris pays dividends every January, April, July, and October.
Bristol-Myers Squibb pays dividends February, May, August, and November.
Intel pays dividends March, June, September, and December.

As a result, investors who buy this “three-stock portfolio” would see an overall yield of 4.1% and cash a dividend check every month of the year.

In addition, all of these stocks offer direct-purchase plans whereby any investor may buy the first share and every share of stock directly from the company, without a broker.

Learn more about this financial newsletter at Chuck Carlson's DRIP Investor.

Phillip Morris International Inc (PM)

I have done an analysis on Philip Morris share and this is what I have discovered:
On the long term graph, I found that this stock is on an uptrend channel. I believe that as long as the chart did not go below the bottom channel, then it will continue to move upward.
As per my short term analysis, this chart is currently consolidating at the range from around $57 to $61. I believe that if the chart can convincingly break the $61 level, then it will continue to move higher from there. However, if the chart break below the $57 level, then it is a big sell. 
Based on the MACD and Stochastic techical indicators, both show negative implication which means that the chart should go down. However, as can be seen in the above chart, the chart does not go down substantially and volume is dropping-meaning lesser selling from here. In other words, it is definetely a consolidation period for the chart to move higher rather than a change in the uptrend to downtrend.

As per the fundamental analysis:
Q4 2009 = $0.81
Q1 2010 = $0.90
Q2 2010 = $1.00
Q3 2010 = $1.00

With a PE ratio of around 15 and growing quarterly earning, I believe that this stock have a potential to increase its revenue and push the stock higher.

I did not hold any position in this stock as I am currently heavily invested in Cisco and Supervalu. I am merely doing this analysis out of curiosity as one of my chatter in my chat box mentioned that he bought some shares in Phillip Morris.

Below are some of the recent articles and analysis on this share:
These Bad Boy Investments are Perfect for This Market
Monday, October 4, 2010 - 12:33 PM

Here's the thing about sin: though ugly, it tends to roll on in any economy.

This fact is a huge benefit to companies that deal in vice. When searching for investments in a slow-growth or uncertain economy, investors often look to defensive industries such as healthcare, food and utilities. After all, people still get sick and need to eat and stay warm regardless of the state of the economy.

But, it's seldom mentioned that people consistently do something else in any economy -- drink and smoke. In fact, vice just might be the most defensive business of all.

Stocks in the cigarette and beer industries seem to keep on making profits and the stocks keep going up regardless of what the market is doing. While the S&P 500 is lower now than it was 10 years ago, Morningstar's cigarette industry category soared at a remarkable average of more than +21% a year for the past 10 years. The Beverage-Brewer (beer) category returned an average of about +16% per year for the same period.

And the outperformance is continuing.

Stocks of cigarette companies are up +24% so far this year and the beer stocks are up a lofty +41% on average, compared to less than +4% for the S&P 500.

While the recovery sputters in an environment even the Federal Reserve calls "unusually uncertain", investors (without a moral objection) might find a profitable port in the storm from the world of vice.

Bad Boys worth a look
Phillip Morris International (NYSE: PM) is the second largest tobacco company in the world (next to China National Tobacco, which has a near monopoly). The cigarette giant owns seven of the world's 15 leading brands, including the iconic Marlboro brand, Parliament, Lark, Chesterfield and others. Operating in 160 countries, Phillip Morris International has a whopping industry-leading 15.4% market share of the international market outside the United States, and 26% not including China.

Phillip Morris International is the international division spun off by Altria (NYSE: MO) in 2008. The spin off freed the company from a host of legal and regulatory hurdles that face Altria, while capturing the growth in international markets. The company generated 42% of first half 2010 revenue in fast growing emerging markets, and has a huge 30% average market share in the top 10 emerging market countries excluding China.

Although highly defensive, the cigarette industry is not immune to economic conditions as smokers quit or buy cheaper brands in a soft economy. The company estimates worldwide cigarette volume will decrease about -2% in 2010. But, the company estimates its own sales volume to increase about +3% to +4% for the year because of exposure to emerging markets.

Phillip Morris International is an absolute cash cow that generates free cash flow of 30% of net revenue (a figure among the highest for large multinational companies). The company just increased the quarterly dividend +7.4% and the stock now pays a solid 4.6% yield.

Boston Beer Company (NYSE: SAM) is the fourth largest brewer in the United States and the largest domestic producer of craft beer with its flagship Sam Adams brand. Craft beer is differentiated from mass produced beer in that it is defined as any beer that sells less than two million barrels per year. Beer drinkers are increasingly choosing the more unique and rich taste of craft beer.

Craft beer has been the fastest growing category in alcoholic beverages. While liquor and mainstream beer sales fell during the recession, craft beer sales increased +6% in 2008 and +5% in 2009. In the first half of 2010, craft beer sales have increased +9% from last year, compared to a year-over-year decrease for mainstream beer sales of -2.7%.

Boston Beer has plenty of room to grow. While net income more than doubled between 2005 and 2009, the company is still relatively small with 2009 revenue of just $415 million. Boston Beer is well-positioned financially, as it has (as of June 30th) $54 million in cash and no debt.

The stock has soared +80% during the past year and +43% year to date, but it still sells at just under 24 times earnings, which is lower than the beer category average and lower than its average multiple for the past five years.

Action to Take --> Both Phillip Morris International and Boston Beer should continue to generate strong earnings in either a good economy or a bad economy. The resilience of these companies makes them ideal investments in today's environment. Both stocks can be purchased at current prices.

-- Tom Hutchinson
P.S. -- For the past few weeks we've been telling you about some of the hottest investment opportunities for 2011. From tiny nuclear power plants that can be buried in your lawn, to revolutionary pain killers made from cobra venom, we're convinced the companies behind these products will soar in the coming year. To get briefed on these opportunities, and several others that we think could return many times your money, please read this memo.

Tom has a 15-year history as a financial advisor with UBS constructing investment portfolios. Tom's background includes a NASD Series 7 and 63 certifications.  Read more...

Disclosure: Neither Tom Hutchinson nor StreetAuthority, LLC hold positions in any securities mentioned in this article.

Merry Christmas!

I wish everybody a Happy Merry Christmas and may all your wishes come true!

Christmas or Christmas Day is a holiday observed generally on December 25 to commemorate the birth of Jesus, the central figure of Christianity.The date is not known to be the actual birthday of Jesus, and may have initially been chosen to correspond with either the day exactly nine months after some early Christians believed Jesus had been conceived the date of the Roman winter solstice,[10] or one of various ancient winter festivals. Christmas is central to the Christmas and holiday season, and in Christianity marks the beginning of the larger season of Christmastide, which lasts twelve days.

Although nominally a Christian holiday, Christmas is also celebrated by an increasing number of non-Christians worldwide, and many of its popular celebratory customs have pre-Christian or secular themes and origins. Popular modern customs of the holiday include gift-giving, music, an exchange of greeting cards, church celebrations, a special meal, and the display of various decorations; including Christmas trees, lights, garlands, mistletoe, nativity scenes, and holly. In addition, several figures, known as Saint Nicholas and certain mythological figures such as Father Christmas and Santa Claus among other names, are associated with bringing gifts to children during the Christmas season.

Because gift-giving and many other aspects of the Christmas festival involve heightened economic activity among both Christians and non-Christians, the holiday has become a significant event and a key sales period for retailers and businesses. The economic impact of Christmas is a factor that has grown steadily over the past few centuries in many regions of the world.

Thursday, December 23, 2010

My Christmas Present of $899 from Supervalu Inc?


Date Bought: Dec 22, 2010
Price: $9.16
Quantity: 8,100
Reason Bought: 
I have recently transferred some of my capital in Cisco to Supervalu. Although I believe that Cisco is a very lovely stock in the long term, I believe that short term gain for Supervalu is at least 10x more higher and faster than Cisco. All technical indicators are pointing to a strong buy. The stochastic indicator show that the blue line is above the red line and it is continuing this pattern strongly. As per MACD, both the histogram and the MACD line show strong positive signal that this stock will continue its upward move. The downtrend line has been convincingly broken and it is going up strongly with a small gap on the upside. The only negative indicator that I notice is that it is currently at the upper side of the Bollinger Band which might show a bit of overbought position. However, I believe it does not matter much as long as the Stochastic and MACD indicator remain very strong. For the long and short term, I am very bullish on this stock and I believe that a 10% gain is inevitable. I believe strongly that I will make at least $10K for this trade which make it a perfect gift for my Christmas present. Although, I agreed with a visitor comment on my chat box "gordon: noone's analysis is 100% correct", however, I believe that with my vast experience and technical skills that I have mastered for a very long time, the odd is definitely on my side.So the Christmas Present of $899 from Supervalu Inc is not entirely true, it should be $10K present for me instead. Now that I have made my trade on this stock, I can only hope and pray!

Some recent positive news on Supervalu Inc are as follow:


Analyst gives Supervalu a boost
Grocer beset by gloomy forecasts
By Tom Webb
twebb@pioneerpress.com
Updated: 12/22/2010 09:46:22 PM CST

Dismissed by Wall Street and bloodied by short-sellers, Supervalu finally got a little love Wednesday: An analyst upgraded the battered stock to a buy.

That breaks a streak of downbeat news for the Eden Prairie-based grocery giant, whose share price has plunged into the single digits, nearly 50 percent off its 2010 high. The Wall Street Journal recently reported that Supervalu held a unique distinction: It was the least-recommended stock in the SP 500, based on analysts' evaluations.

But now, analyst Ajay Jain of Hapoalim Securities has broken from the pack. Sort of.

"It's not like I'm unaware of the issues that the company is facing," Jain said Wednesday. But now he sees shares so cheap — they closed Tuesday at $8.85 — that "we thought that the risk/reward looked a little better."

On Wednesday, the upgrade got noticed. Shares rose nearly 5 percent to $9.26.

Supervalu's "issues" still remain: a huge debt load from its 2006 acquisition of the Albertson's grocery empire, competition from nonunion grocers like Wal-Mart and Target and its position as a supermarket company as consumers shift away from traditional supermarkets.

Yet, it remains a giant: $40 billion in annual revenue, with 2,300 stores holding strong market shares in a dozen U.S. communities, including the Cub Foods chain in the Twin Cities. On the Fortune 500 list of America's largest corporations, Supervalu ranked No. 47. (That was ahead of Apple, Walt Disney and Intel.)

But after watching it lose market share and money, many investors have lost faith in Supervalu. The company trades for only six times next year's projected earnings. That has fueled a round of rumors that private-equity buyers may be circling, looking to pounce on a company with a market capitalization of $2 billion.

Jain said his upgrade was "purely a valuation call" and not based on any possible takeover buzz. "That kind of speculation is bound to result in disappointment," Jain said.

Tom Webb can be reached at 651-228-5428.
==================================================

Red's Bull Trade Alert: SUPERVALU (NYSE:SVU)


Red's Bull Trade Alert: SUPERVALU (NYSE:SVU)
23 December 2010

LTN's Pattern Recognition Analyst, Paul A. Ebeling, Jnr, ID'd  the start of a New Bullish Trend for  SUPERVALU.

Shares of SUPERVALU gained 0.41 (4.63%) to 9.26.

The stock closed at 8.85 Tuesday and opened Wednesday at 8.98.

SVU's daily range was 8.96 and 9.37 on the Day.

Volume: 7,118,404/shrs is greater than average 90 day volume of 5,995,130/shrs.

My Technical indicators augur Bullish price movement in here.

SVU is trading below its 50 Day Moving Average and below its 200 Day Moving Average, its 52 week low is 8.20 and 52 week high is 17.89, the P/E is N/A, the EPS is - 5.66 and the Div & Yield is 0.35 (4.00%).

AnalysisOverallShortIntermediate       Long
Neutral (-0.16)Neutral (0.03)Neutral (-0.01)Very Bearish (-0.50)

Recent CandleStick Analysis  Bearish
DateCandle
20 Dec 2010Bearish Engulfing
17 Dec 2010
DOJI
Open Gaps
DirectionDateRange
Up22 Dec 20108.89 to 8.96
Down19 Oct 201012.2 to 11.5

Support and Resistance
TypeValueConf.
resist.12.402
resist.11.846
resist.11.505
resist.11.058
resist.10.836
resist.10.372
resist.10.214
resist.9.882
resist.9.723
supp8.886
supp8.335

Disclaimer: The material presented in this commentary is provided for informational purposes only and is based upon information that is considered to be reliable. Neither Ebeling-Heffernan, www.livetradingnews.com  nor its affiliates warrant its completeness, accuracy or adequacy and it should not be relied upon as such. Neither Ebeling-Heffernan, www.livetradingnews.com nor its affiliates are responsible for any errors or for results obtained from the use of this information. This material is not intended as an offer or solicitation for the purchase or sale of any security or other financial instrument. Securities or other financial instruments mentioned in this material are not suitable for all investors. Any opinions expressed herein are given in Good Faith, are subject to change without notice. Before acting on any information contained on the website, you should consider whether it is suitable for your particular circumstances and strongly consider seeking advice from your own financial or investment adviser.
Tags:
================================================

The Best Rebound Stocks in the S&P

Monday, December 20, 2010 - 10:30 AM
arring a year-end shocker, 2010 will go down as a good year for stocks. The S&P 500 is up more than 10% this year, and roughly 75% of stocks in the index are in the black in 2010. Of course, the other 25% would like to get past 2010, especially those that have been hit hard. I went rummaging through the dustbin of S&P 500 losers and have found a few intriguing rebound candidates for 2011.

A few of these names will be familiar to our readers. I recently suggested that grocery chain SUPERVALU (NYSE: SVU) looked far too cheap, especially when compared to other industry players.
I also continue to think that Office Depot (NYSE: ODP) is once again finding its footing, and should close some of the valuation gap with rivals Staples (Nasdaq: SPLS) in 2011. H&R Block (NYSE: HRB)
The price-to-earnings (P/E) ratio on this tax prep firm really gets your attention. But few would argue for a higher earnings multiple at the moment. With unemployment at high levels, demand for the company's software and services are at a multi-year low.
Well, it may be a no-growth business right now, but free cash flow remains quite impressive. H&R Block has generated a cumulative $1.0 billion in free cash flow during the past two years. While business slumps and shares trade at levels last seen in 2002, management has decided to use some of that cash flow for ongoing stock buybacks. The company's share count has fallen by 10% in the past year, and management expects to take another chunk of the share count out of the public's hands in 2011. And while investors wait, they can also focus on the company's 4.6% dividend yield.
Will results rebound in 2011? Perhaps, but it will likely be a few years before improving employment trends enable H&R Block to post meaningful growth again. In the interim, the shrinking share count should set the stage for eventually higher per share profits. And it's unlikely that business will slump further, so that miniscule P/E ratio likely provides solid downside to the stock. If you're looking for long-term appreciation and a healthy dividend, H&R Block is emerging as a solid discounted play.
Diamond Offshore (NYSE: DO)
One notable event stood out as the black-eye of 2010: the Gulf oil spill, which along with BP (NYSE: BP), took down shares of Diamond Offshore, an operator of 46 offshore rigs for clients on several continents. Diamond is the country's second-largest provider of offshore drilling services, by market value. The company's shares plunged from $100 at the beginning of the year to around $60 by June, and they've been stuck there ever since.
The Gulf oil spill surely hurt. Sales are on track to fall -8% in 2010, while profits are off by a third. And few expect a sharp snapback in 2011, as drilling in the Gulf remains below previous levels while the industry settles on new safety standards. This business is all about supply and demand. With weak rental demand for these ultra-expensive rigs, asking prices are off sharply. The industry must now wait for demand to catch up with the supply of rigs, at which time daily lease rates should rebound.
More than likely, gulf drilling activity will only slowly rebound during the course of 2011, setting the stage for much improved results in 2012. As investors look ahead and anticipate that rebound, and a jump back in earnings per share (EPS) toward the $10 mark in 2012, shares should make up some of the lost ground from 2010.
Action to Take --> All the companies on this list sold off for good reason. But SUPERVALU, Office Depot, Diamond Offshore and Office depot sill look poised for better days ahead. Near-term results could still be uninspiring, but incremental improvements should bring some of these deep value names back onto investors' radars in 2011.

-- David Sterman
===============================================
Stock Analysts Agree: Supervalu Is no 'Buy'

By Ben Steverman

Of 14 Wall Street analysts who follow the supermarket company, none recommend the shares, spurring some contrarian investors to seek opportunity as Supervalu pays down debt

Supervalu (SVU) may be the least-loved large-cap stock on Wall Street: Not one of the 14 analysts who cover the supermarket company recommends that investors buy shares. Among the seven stocks in the Standard & Poor's 500-stock index without a buy rating, Supervalu is followed by the largest number of analysts, according to Bloomberg data.

Ordinarily diplomatic—and cautious when criticizing companies they cover—analysts are blunt about Supervalu, a 150,000-employee grocery chain that sells under various brands, including Albertsons on the West Coast, Acme in Philadelphia, Jewel in Chicago, and Shaws in New England.

"I don't think they're going to be able to recover from their current challenges," says Karen Short, an analyst at BMO Capital Markets, who rates the shares "market perform."

"Their base business is in a very poor position," says Jefferies & Co. analyst Scott Mushkin, who says shareholders would probably be better off if the company were broken up and sold to competitors. He has a "hold" rating on the shares.

In second-quarter results reported on Oct. 19, Supervalu's same-store sales fell 6.4 percent and total sales dropped 8.5 percent, to $8.66 billion, vs. year-earlier results. As consumers defected to other retailers, the chain's customer count was down 3.9 percent from a year ago, a decline that Janney Capital Markets analyst Jonathan Feeney called "awful." Feeney gives the shares a "neutral" rating.

Minuscule Price-to-Earnings Ratio
In the counterintuitive world of stock investing, unanimous negativity can attract buyers looking for a deal. "Overpessimism is what attracts us to the stock," says Thomas Villalta, lead portfolio manager of the Jones Villalta Opportunity Fund (JVOFX), a Supervalu shareholder. He says the stock is "significantly undervalued."

Supervalu shares are down 14 percent in 2010, compared to supermarket chains Kroger (KR) and Safeway (SWY), which are up 7.2 percent and 7.6 percent, respectively. For Supervalu, the price-to-earnings ratio, a common measure of valuation, is 6. For mass-market retail peers, the average p-e is 15, according to a Bloomberg data measure that includes Wal-Mart Stores (WMT), Kroger, Safeway, Whole Foods Market (WFMI), CVS Caremark (CVS), and Walgreen (WAG).

Craig Herkert, a former Wal-Mart executive, took over as Supervalu's chief executive officer in May 2009 and is trying to turn the company around by cutting costs, lowering prices, and paying down debt. "It may be too little, too late," says Ajay Jain, an analyst at Hapoalim Securities, who has a "neutral" rating on shares.

Analysts' list of concerns about Supervalu start with its debt load. At the end of the last quarter, the chain had $7.1 billion in total debt, most stemming from the acquisition of the Albertsons grocery chain in 2006, which more than doubled its sales while increasing its debt load sixfold.

Few worry that Supervalu could default on this debt soon. In fact, the company is paying debts down faster than it had previously indicated, including a $650 million reduction forecast by the company for this fiscal year, which ends in February.

Paying Debt Leaves Little Flexibility
"The debt is manageable for now," says Evan Mann, an analyst at credit research firm Gimme Credit.

The problem is that debt payments leave less money for other needs. "It doesn't give them a lot of business flexibility," Jefferies' Mushkin says.

And Supervalu has many urgent priorities. From marketing to technology, the company's systems are behind those of competitors in many areas, analysts say. "They're just so far behind, I don't know that there is any way to catch up," BMO's Short says. She adds that the chain also hasn't effectively responded to the latest retail trends, from discounters' new food offerings to the growth of specialty chains such as Trader Joe's. "They have not kept pace," she says.

Herkert, Supervalu's CEO, has acknowledged the problems and is trying to catch up. He has brought in a new management team, is centralizing such functions as marketing, and is changing the assortment of items on shelves to a more efficient mix. He is also positioning Supervalu as "America's neighborhood grocer" by adding more local merchandise to each store.

Analysts say many Supervalu stores need to be renovated, particularly those acquired in the Albertsons deal. "The Albertsons store fleet was kind of caught up in a time warp," Jain says. "You have to put a lot of capital in those stores, to wow customers [and] get them to come back," Short says.

Supervalu Can't Afford Pricing Wars
Kenneth Levy, Supervalu's vice-president of investor relations, says stores are being renovated and replaced at the correct pace. In fact, the condition of stores isn't the main reason for recent sales declines, he says: "Now, more than any other factor, customers are shopping based on price."

While Supervalu prices vary from one area of the country to another, analysts and executives agree that they are too high, compared to those of nearby competitors. In some geographic markets, Mushkin says, Supervalu's reputation for higher prices is so bad that it may need to price significantly below competitors in order to bring back customers—which would provoke rival supermarkets to respond. Given the chain's debt level, he says, "they just don't have the financial wherewithal to get in a pricing war."

Supervalu has started adjusting prices, although it's not trying to undercut discount stores such Wal-Mart. "We need to be fair on price," Levy says. "We don't need to be the low-cost provider." He notes that with its wide assortment and convenient locations, "there are clearly some advantages to being convenient to shop."

This is the dilemma that caused Don Wordell, portfolio manager of the RidgeWorth Mid-Cap Value Equity Fund, to sell his Supervalu shares in the late spring: Cutting prices makes it harder to pay back debt, but high prices are scaring away consumers. "I just don't see the light at the end of the tunnel," he says.

Wordell had been pinning some hopes on the possibility that Supervalu could raise cash by selling off stores, but most such sales have been small. On Oct. 29, Supervalu announced the sale of its 14-store Bristol Farms division. Sale terms were not disclosed. Supervalu has also been making acquisitions, including the purchase of a six-store pharmacy chain in Missouri and Illinois, announced on Oct. 18.

Could Save-a-Lot Save the Day?
As of July 20, Supervalu owned 1,161 supermarkets in the U.S., while also operating the 1,200-store Save-a-Lot discount chain and a food distribution business that serves 1,910 independent grocery stores.

The Save-a-Lot chain, which features small grocery stores selling only Save-a-Lot brand merchandise, is one source of investor hopes for Supervalu's future. "That's a real growth vehicle for the company," Levy says, noting plans to double the number of Save-a-Lot stores in the next five years.

There is also evidence that the sales slide at Supervalu's supermarkets could be stopping. The company projects same-store sales to improve from the first to second halves of its 2011 fiscal year. In the first five weeks of the current third quarter, same-store sales improved by one percentage point from the second quarter, senior vice-president of finance Sherry Smith told analysts on Oct. 19.

Whatever the reasons for hope, equity analysts see few catalysts to improve Supervalu's earnings in the near future, says Gimme Credit's Mann. Supervalu is "doing the right things but it takes time to change people's shopping behavior," he says, noting that any improvement could take two or three years.

Alan Lancz, president of investment firm Alan B. Lancz & Associates, has been buying Supervalu shares, betting they will rise along with other grocery chains when the economy improves and food inflation boosts the value of inventories. But he freely admits the company's serious problems. "With Supervalu, it's going to take a little patience," he says.


Steverman is a reporter for Bloomberg News . 

Tuesday, December 21, 2010

My $118,000 Buy Transaction on Cisco

Cisco is currently trading on the downside range. I believe the recent fall is an opportunity to buy because I believe that based on the range above, Cisco will eventually bounce back and hit the 1st resistance which is at $22.50.


Date Bought: Dec 9, 2010
Price: $19.67
Quantity: 6,000
Reason Bought: After losing more than 20% recently due to the recent announcement of forecast drop in next quarter sales, Cisco now look very attractive. If we look at the early of the year in April, Cisco was trading at the $28 level which is a drop of more than 40% based on the current price of $19. 
All the indicators points to a buy except the MACD histogram which shows a bit of negative side.However, as long as the MACD blue line is above the red line and heading upwards, I am confident of the strength on the recovery of this stock for at least a 10% gain.

I have previously lost 3k trading this share. I sold earlier for a 3k losses in Cisco, because I have transferred my fund to buy Cirrus Logic which have helped me to gain a whopping $15K profit.

Fundamentally,  Cisco is still very strong. The last four quarters of earning are as per below:
Q2 2010 = 0.40
Q3 2010 = 0.42
Q4 2010 = 0.43
Q1 2010 = 0.42

Date Sold: Dec 27, 2010
Price: $20.00
Quantity: 6,000
Reason Sold: I have sold this stock because I think that this stock is not strong enough to further push upward.
Profit/loss: +$2,000
Mistake: I am dead wrong when I think that this stock do not have the strength to push forward. As of today, as of today Feb 2nd, 2011, this stock is now trading at $21.62.
I have purely sold this stock due to my emotional stress from Supervalu as I have transfered some of my capital to Supervalu. The stress from the lost in my Supervalu has caused me to to have the mentality of taking profit in Cisco while I still can. It is obviously a wrong mistake that I have made as Cisco continue to push forward to the $21.00 level and above.
====================================================
Disclaimer : This is not an investment advisory, and should not be used to make investment decisions. Information in The Market Oracle Blog is often opinionated and should be considered for information purposes only. No stock exchange anywhere has approved or disapproved of the information contained herein. There is no express or implied solicitation to buy or sell securities. The charts provided here are not meant for investment purposes and only serve as technical examples. Don't consider buying or selling any stock without conducting your own due diligence.

Sunday, December 19, 2010

My Dryship Trade - Profit 3K

Date Bought: Aug 9, 2010
Price: $4.99
Quantity: 24,000
Reason Bought: Chart Shown a Smooth Uptrend Pattern
Mistake: MACD and Stochastic already shown an over stress indication.
Lesson to be learned: Should have waited a bit longer. Do not have the patience to wait.

Date Sold: Nov 11, 2010
Price: $5.14
Quantity: 24,000
Reason Sold: The Bollinger Band indicator has shown a reversal pattern, the stochastic blue line is almost crossing to the red line. The MACD indicator however show that there is more room to go before it reverse. True enough, the same day after I sold the stock shoot up to $5.60.
Lesson to be learned: Should have waited a bit longer, however, I am afraid that I will lose back the 20% that I have waited for so long to rebound. That is why I firmly believe that buying at the right time is more important than selling at the right time. I would have make more than 20% or above if I have waited for the stock to come down at $4 first.
Profit Earned: $3K

Saturday, December 18, 2010

Is Supervalu a Super Value buy?

I have recently notice this stock while surfing the internet. This stock looks interesting because it has a good quarterly earning and a very low PE ratio. Although, I am currently heavily invested in Cisco, I would like to know more about this stock and why it keeps going down eventhough it looks like a good stock to me.

For a wider look at this chart, it shows that Supervalu has been going down from $40 in 2008 to about $8 as of today.

Technical Analysis:
For the current short term outlook, this stock is definetely a buy on the 3 technical indicator that I have always relied on.
As shown above the MACD indicator shows that the histogram is currently going up with a nice upward slope. As per the line, the blue line has crossed over above the red line and it does not shown any sign of weaknesses yet.
As per the Stochastic indicator, it shows that the blue like is moving upward above the red line with a strong push. I believe the blue line will at least reach the upper side of the 80% before it start consolidating downward again.
As per the Bollinger Band, it is currently at the slightly upper middle level of the band, I believe that it will go to the upper side of the band which is around $9.6 level in the very near future.

Fundamental Analysis:
Based on the last four quarter earning, eventhough it does show a little bit of decreasing in the last quarter, however, I believe that the coming quarter will be improved together with the US economy.
Quarter 3, 2010 = 0.46
Quarter 4, 2010 = 0.62
Quarter 1, 2011 = 0.43
Quarter 2, 2011 = 0.28

Analysis from the other authors on this stock also indicated a buy for this stock whether in short or long term. I think this stock has a very good potential as the earning are still there and moreover, the dividend for this stock is also attractive. I have invested less and 10% of more total capital in this stock. I am thinking of shifting my capital from Cisco into this stock on this coming Monday.
======================================================

SuperValu: Leveraged Buy-Out For Retail Investors


=========================================================
I've Uncovered a Trade That Could Pay off Big...
Posted 12/8/2010 12:00 PM by David Sterman from David Sterman in Investing

The rules of a paired trade are quite simple. Find a good company and make a bullish investment while also finding a lousy company in the same industry and make a bearish short investment against it.

That logic surely applies when two companies appear comparably valued. But what do you do when the solid operator appears quite overpriced and the lousy operator appears to be far too cheap? Well, you have to turn the paired trade theory on its head.

That's precisely the dynamic in place in the supermarket industry. Whole Foods (Nasdaq: WFMI ) is a very well-managed company with a stellar track record. Supervalu (NYSE: SVU ) has clearly been the dog of the industry for quite some time. Yet this dog may soon have it day, and paradoxically is the better investment.

Differing business models... for now
Whole Foods has single-handedly altered what consumers think of in terms of grocery stores. Its emphasis on healthy foods in an inviting shopping environment has allowed it to charge premium prices. That's why it can generate 5% EBITDA margins while most grocers must make do with 2% to 3% margins -- at best. And business at Whole Foods has rebounded impressively in 2010, despite a still-weakeconomy . Moreover, Walmart's (NYSE: WMT ) aggressive push into groceries has surely hurt business at traditional supermarket chains like Supervalu and Kroger (NYSE: KR ) to a much greater extent than Whole Foods.

That helps explain why Whole Foods is boosting revenue at a +10% clip (aided by store openings), while Supervalu's sales are shrinking more than -5% (partially due to selective store closings). But food retailing is a funny business. Grocery chains can -- and often do -- re-invent themselves. By upgrading stores, changing the merchandise mix and tinkering with pricing, they can alter the perception among consumers and draw back lost shoppers. And that's precisely what Supervalu is doing, spending more than $500 million in the current fiscal year to remodel stores. (Despite that spending, the company will still generate more than $1 billion in free cash flow this year, according to UBS.)

It will be likely be several years before consumer perceptions of Supervalu's stores can improve, so you shouldn't look for it to morph into an industry leader overnight. Nor should you expect this company to eventually be seen in the same light as Whole Foods, which has a strong grip on the premium end of the market. That said, as rivals like Supervalu and Kroger try to replicate the look and feel of successful grocers like Whole Foods, all of the players should see their operating metrics revert to the mean.

By the numbers
Even before Supervalu takes steps to improve results, itsshares are already stunningly cheap by a variety of investment metrics. For example, it trades for less than six times projectedearnings -- that's one-fifth of the multiple garnered by Whole Foods. And both of these companies are comparably valued in terms of enterprise value , even though Supervalu's sales base is four times as large and its EBITDA is twice as high.


Shares of Supervalu are also in the doghouse because of a stubbornly high debt load , which still exceeds $6 billion. The company's equity is worth less than $2 billion. And that, in a nutshell, is the primary reason why you should be bullish on Supervalu, even as its operations stumble right now. Any company with very high levels of debt often sees its equity come under pressure due to concerns about potential financial distress. But Supervalu, even with its subpar results, generates ample cash flow to cover its interest expenses and take down some principal . So over time, that debt load is likely to shrink, taking the total enterprise value down with it.

For example, let's say Supervalu reduces debt from $6 billion to $4 billion in the next three years thanks to operating cash flow and selective asset sales. For its enterprise value to stay constant, equity would rise by a commensurate amount that the debt falls. That means its market value would rise from the current $1.8 billion to $3.5 or $4.0 billion.Shares would likely double from this -- without the company's enterprise value changing one iota.

There's a decent chance that Supervalu won't be around as a public company long enough to see that change. Rumors have popped up that private equity (PE) firms are sniffing around. Yes, this grocer has more debt than PE shops would like, but the cash flow capabilities relative to its existing debt load are awfully enticing. I have no idea if the rumors are true, but the logic is solid.

Action to Take --> It's hard to see howshares of Whole Foods can rise any higher, already trading for nearly 30 times projected fiscal (September) 2011 results. If anything,shares are vulnerable to a slow downward drift as other grocers start to replicate its business model . If you want to use a paired trade strategy, that's the short side of it.

Meanwhile, on the long side,shares of Supervalu look significantly undervalued in the context of the grocer's still-strong cash flow. Management needs to proceed with some financial engineering to unlock shareholder value. But withshares now trading at levels last seen in 1990, they get the message.

-- David Sterman
==========================================================

Should You Sell SUPERVALU Today?

Should you sell SUPERVALU (NYSE: SVU) today?
The decision to sell a stock you've researched and followed for months or years is never easy. If you fall in love with your stock holdings, you risk becoming vulnerable to confirmation bias -- listening only to information that supports your theories, and rejecting any contradictions.
In 2004, longtime Fool Bill Mann called confirmation bias one of the most dangerous components of investing. This warning has helped my own personal investing throughout the Great Recession. Now, I want to help you identify potential sell signs on popular stocks within our 4-million-strong Fool.com community.
Today, I'm laser-focused on SUPERVALU, ready to evaluate its price, valuation, margins, and liquidity. Let's get started!
Don't sell on priceOver the past 12 months, SUPERVALU is down 32.6% versus an S&P 500 return of 11.3%. Investors in SUPERVALU are no doubt disappointed with their returns, but is now the time to cut and run? Not necessarily. Short-term underperformance alone is not a sell sign. The market may be missing the critical element of your SUPERVALU investing thesis. For historical context, let's compare SUPERVALU's recent price with its 52-week and five-year highs. I've also included a few other businesses in the same or related industries:
Company
Recent Price
52-Week High
5-Year High
SUPERVALU$10.73$17.89$49.80
Kroger (NYSE: KR)$22.01$24.12$31.90
Safeway (NYSE: SWY)$22.75$27.04$38.30
Whole Foods Market (Nasdaq: WFMI)$39.85$43.18$79.90
Source: Capital IQ, a division of Standard & Poor's.
As you can see, SUPERVALU is down from its 52-week high. If you bought near the peak, now's the time to think back to why you bought it in the first place. If your reasons still hold true, you shouldn't sell based on this information alone.
Potential sell signsFirst, let's look at the gross margins trend, which represents the amount of profit a company makes for each $1 in sales, after deducting all costs directly related to that sale. A deteriorating gross margin over time can indicate that competition has forced the company to lower prices, that it can't control costs, or that its whole industry's facing tough times. Here is SUPERVALU's gross margin over the past five years:
anImage


Source: Capital IQ, a division of Standard & Poor's.
SUPERVALU has been able to grow its gross margin, which tends to dictate a company's overall profitability. This is great news; however, SUPERVALU investors need to keep an eye on this over the coming quarters. If margins begin to drop, you'll want to know why.
Next, let's explore what other investors think about SUPERVALU. We love the contrarian view here at Fool.com, but we don't mind cheating off of our neighbors every once in a while. For this, we'll examine two metrics: Motley Fool CAPS ratings and short interest. The former tells us how Fool.com's 170,000-strong community of individual analysts rates the stock. The latter shows what proportion of investors are betting that the stock will fall. I'm including other peer companies once again for context.
Company
Short Interest (% of Float)
SUPERVALU***11.7
Kroger***2.4
Safeway**8.5
Whole Foods Market***10.6
Source: Capital IQ, a division of Standard & Poor's.
The Fool community is in the middle of the road on SUPERVALU. We typically like to see our stocks rated at four or five stars. Anything below that is a less-than-bullish indicator. I highly recommend you visit SUPERVALU's stock pitch page to see the verbatim reasons behind the ratings.
Here, short interest is at a high 11.7%. This typically indicates that large institutional investors are betting against the stock.
Now, let's study SUPERVALU's debt situation, with a little help from the debt-to-equity ratio. This metric tells us how much debt the company has taken on, relative to its overall capital structure.
anImage


Source: Capital IQ, a division of Standard & Poor's.
SUPERVALU has taken on substantial debt over the past five years. Even with increasing total equity over the same time period, debt-to-equity has increased, as seen in the above chart. Based on the trend alone, that's a bad sign. I consider a debt-to-equity ratio below 50% to be healthy, though it varies by industry. SUPERVALU is above this level, at 513.5%.
The last metric I like to look at is the current ratio, which lets investors judge a company's short-term liquidity. If SUPERVALU had to convert its current assets to cash in one year, how many times over could the company cover its current liabilities? As of the latest filing, SUPERVALU has a current ratio of 0.85. This is a bad sign for SUPERVALU. The company's current liabilities are greater than its current assets, which means it could have liquidity issues in the short term.
Finally, it's highly beneficial to determine whether SUPERVALU belongs in your portfolio -- and to know how many similar businesses already occupy your stable of investments. If you haven't already, be sure to put your tickers into Fool.com's free portfolio tracker, My Watchlist. You can get started right away by clicking here to add SUPERVALU.
The recap
anImage

SUPERVALU has failed four of the quick tests that would make it a sell. Does it mean you should sell your SUPERVALU shares today solely because of this? Not necessarily, but keep your eye on these trends over the coming quarters.
Remember to add SUPERVALU to My Watchlist to help you keep track of all our coverage of the company on Fool.com.
If you haven't had a chance yet, but sure to read this article detailing how I missed out on more than $100,000 in gains through wrong-headed selling.
=======================================================

Capitulation in SuperValu?

When assessing a difficult-to-value stock for the first time, my initial question is always, "How is the market likely perceiving the equity?" It makes little sense to arrive at a fair value based on a forward P/E multiple when everyone else is looking at a stock based on price / tangible book, for example. SuperValu (SVU) is currently a turnaround story to which sell-side analysts attribute either a P/E or an Enterprise Value / EBITDA haircut relative to the grocer peer group to arrive at a target price.
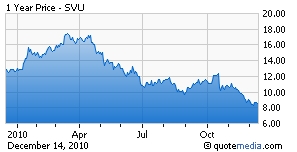
I haven't been able to figure out how exactly they arrive at the magnitudes of the haircuts, but I suspect their methodologies are qualitative in nature (i.e., SWAGs). They may be right in their approaches, but I don't think so. Furthermore, from a technical perspective, the slide from $12.40 at close of trading on October 18th to an intra-day $8.20 on December 7th appears to have run a capitulation course I've observed in the past (e.g., BP from early May to late July 2010). Absent incremental downside catalysts, the market has fully priced in the company's long road to deleveraging, stabilizing gross profits and optimizing the cost structure.
Though not without pitfalls, calculating the present value of SuperValu's dividends in perpetuity offers a better and more objective approach to assessing fair value. The assumptions I used for a dividend discount model were:
  • Annual dividend = $0.352
  • Dividend growth = 0%
  • Cost of equity = 2.1%
The ensuing target price per share was $0.352 / (0.021 - 0.000) = $16.53, a 90% premium to the $8.70 close on December 10. No growth in annual dividends is reasonable given the (i) company's intent to deleverage and (ii) halving of the dividend in the last year. Will management cut the dividend again? Unlikely.
Reducing the ~$75M in annual dividends that are expected over the coming years would neither make a material dent in SuperValu's $7.5B of outstanding debt nor enable needle-moving CapEx for store remodeling and / or build out. Also, the dividend payout ratio, based on pro forma earnings, has been in the 24% to 25% range over the prior five years, this fiscal year excepted. A $75M payout for the next three years is within this range, and unless management wishes to really tank shareholders and its own equity incentives, there is no reason for another reduction.
The cost of equity obviously appeared too low at first blush, but the company's levered beta year-to-date is 1.05. When unlevered, beta went down to 0.30 and resulted in a 2.1% cost of equity if the outstanding debt eventually going to zero was assumed (well, the valuation model does contemplate dividends in perpetuity). More realistically, however, the beta should be somewhere around 0.7, which translates to a target share price of about $7.60, a discount of 13% to Friday's close.
Given a 13% downside and 90% upside, I have become bullish with conviction on SuperValu. As usual, laddering into a long position would be appropriate in case the knife has a bit further to fall.
Disclosure: I have no positions in any stocks mentioned, and no plans to initiate any positions within the next 72 hours.
About the author: Jx Capital
Jx Capital picture
The author is the founder and managing director of Jx Capital Management, a long / short equity derivatives hedge fund


Related Posts Plugin for WordPress, Blogger...