

Click on the above image to enlarge
I am currently in a big dilemma as I am currently long in Axti. I am rather confused as well when I study the technical on this chart. It appears that all technical indicators such as Stochastic, MACD and Bollinger Band point to an upward move for this stock. However, for the past 2 days, this stock is not advancing as expected. Instead, it is currently trading sideways with low volume. The recent days low volume is definitely not a good sign because it shows that although the stock is rebounding from the previous low, however, it is still very weak as the buyer is not stepping in.
There is a also a downward gap at around $8.3 to $7.7 level. I am also expecting that this gap will be filled going forward. But I might be wrong because not all gap are filled. If this gap is filled, then I am guarantee a profit of more than 20%. However, as I point it out in my heading, not all technical analysis is accurate and sometimes I may be wrong and the stock will go the opposite way instead.
I really spent a lot of hours look and analyzing this stock. Even though I strongly believe that this stock will go up in the coming months but there is not guarantee to it.
I have recently read a very interesting article on how good this stock is but it still no guarantee that this stock is going up. This article by Ben Axler was published on the famous website www.seekingalpha.com on March 21, 2011, however, on March 22 and 23, the stock go down instead by around 2 percents.
I have been trading the stock market for more than 12 years already and reading stock chart should be my forte, however, I admit that from time to time, I did make few big mistakes and it cost me hundred thousand of dollars. Trading in the market is truly not an easy game for anybody, once must have the discipline and able to control the emotion such as greed and fear. As Alexander the Great once said "Control your fear and you conquer death". I would say "Control your fear and you conquer wealth".
I am currently long in Axti. If these few days the stock is not performing as expected, I will not hesitate to cut loss as I have place my cut loss level at $6.00.
================================================
Below is a very good article published by Ben Axler on AXT Inc.
AXT Inc.: Oversold and Undervalued Technology Stock
AXT Inc. (AXTI) is a very attractive business currently trading at a compelling valuation. AXTI is coming off its best year ever and is poised for increasing sales and earnings in the coming years, as the end markets for its products tied to mobile smart phones, LED and solar technology increase.
Company Overview:
AXTI is a leading developer and producer of high-performance compound and single element semiconductor substrates, including substrates made from gallium arsenide (GaAs), indium phosphide (InP) and germanium (Ge). The substrates are primarily semi-insulating and semi-conducting.
End Markets: Power amplifiers and radio frequency integrated circuits for wireless handsets (cell phones), direct broadcast television, high-performance transistors, satellite communications, high brightness light-emitting diodes, optical couplers, satellite and terrestrial solar cells, lasers, and optical couplers.
Manufacturing: AXTI manufactures all semiconductor substrates using its proprietary vertical gradient freeze (VGF) technology. Most of its revenue is from sales of GaAs substrates. It manufactures all of its products in China, which generally has favorable costs for facilities and labor compared with comparable facilities in the United States, Europe or Japan. It also has five joint ventures in China that provide pricing advantages, reliable supply and shorter lead-times for raw materials central to final manufactured products.
Customers: Its 10 largest customers for 2010 were: Avago Technologies Trading Ltd. (AVGO); AZUR Space Solar Power GmbH; Beijing China Crystal Technology Ltd.; Hitachi Cable Ltd.; The IQE Group; Nan Da Guang Dang; Osram Opto Semiconductors GmbH; Sumika Electronic Materials, Inc.; Sumitomo Chemical Co. Ltd. (SOMMF.PK) and Visual Photonics Epitaxy Co.
Competition: Primary competition in the market for compound semiconductor substrates includes Beijing Compound Crystal Technology, Ltd.; Freiberger Compound Materials; Mitsubishi Chemical Corporation; and Sumitomo Electric Industries. AXTI believes at least two of its competitors are shipping high volumes of GaAs substrates manufactured using a technique similar to its VGF technique. In addition, it also faces competition from compound semiconductor device manufacturers that produce substrates for their own internal use, including Hitachi (HIT), and from companies such as IBM that are actively developing alternative compound semiconductor materials. AXTI is the only compound semiconductor substrate supplier to offer a full suite of raw materials.
Investment Thesis:
AXTI's business model is attractive for a number of reasons including:
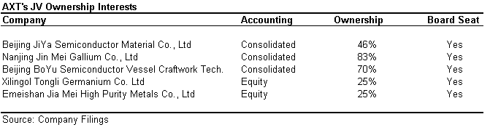
1. High barriers to entry in its industry with a supply chain that is nearly impossible to replicate. It has joint venture ownership interests in numerous Chinese companies that control extremely rare and critical materials called gallium, germanium and indium. These materials are so limited in production that they were labelled as critical materials by the EU.
These JVs were set up over the course of the past 10 years, and represent significant hidden value to shareholders. The JVs ensure critical raw materials in the supply chain and partially insulate the company against the cost pressures facing its competition. The company spent the better part of the decade optimizing its supply chain and seeking high client qualification requirements to win business and slowly take market share. Given China's increasingly tight grip on rare earth elements and critical materials in the past few years, it would be extremely difficult, if not impossible, to reproduce what AXTI has accomplished.
[Click all to enlarge]
2. Few competitors and increasing market share. There are very few competitors in the markets AXTI sells to, and none control the supply chain like it does. A few main competitors are located in Japan, and as of this write-up, there are reports that Hitachi Cable has had some severe issues and may be offline for several weeks or even a couple of months. Competitor Sumitomo appears to be nearly unaffected, as its crystal growth is well south of Tokyo. Nevertheless, given the precarious position of having a high concentration of supply in Japan, customers may increasingly turn to AXTI for a more secure/stable source of product supply. Given capacity expansions in recent years and further planned expansion, AXTI may be best positioned to respond to customer demands.
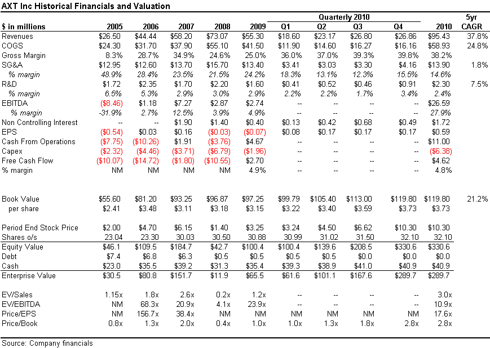
3. Operating leverage: There's tremendous operating leverage in the business due to its low cost operations in China. While sales have grown at a 5yr CAGR of 38%, SG&A has grown at sub 2%. SG&A margin has fallen from almost 50% in 2005 to 14.6% in 2010. Likewise, years of R&D spending are finally paying off and have decreased from 6.5% of sales in 2005 to 2.4% of sales in 2010. Most R&D spending goes to process improvement and manufacturing efficiency research. Gross margin improvement has increased from the mid-20% range in 2008/2009 to a record 39.8% in Q4'10. This margin improvement is despite increasing gallium/germanium/indium raw material costs. Management has guided steady state gross margins in the 35-40% range, so anything above 40% represents material upside.
4. Minimal capex requirements to expand capacity to meet growing customer demand: Total manufacturing space in China is ~190,000 square feet, 160,000 square feet of which is currently being used; the company is currently preparing the remaining 30,000 square feet for increased wafer processing. It also expects to begin construction of a new 80,000 sq ft facility in Beijing. Competitors typically purchase crystal growing furnaces from original equipment manufacturers. In contrast, AXTI designs and builds its own VGF crystal growing furnaces, which it believes should allow it to increase production capacity more quickly and cost-effectively. Total capex is estimated to be $11m in 2011 and should easily be covered by cash from operations.
Recent Developments:
AXTI's share price had steadily been rising throughout 2009-2010 as it recovered from the industry downturn and proved capable of consistently delivering earnings ahead of its guidance. The company attracted two research brokers, including Needham and Northland, who each placed $10+ targets and backed the company's outlook for strong secular growth.
In the recent quarter, the company met its quarterly estimates, but offered softer Q1'11 guidance than the overly bullish analysts had hoped for by only 2 cents, due to a seasonally weak Q1 LED market. Even though the company's Q1'11 guidance range of $0.11-0.13 cents/share represents 28-63% growth over Q1'10 results of $0.08 cents/share, analysts aggressively cut estimates for 2011 almost to the point of expecting no EPS growth, and the stock has fallen over 50% from its highs earlier this year.
Part of the precipitous stock decline can be explained by the fact that AXTI's two largest shareholders are quant fund managers, and as short sellers piled in, the selling pressure was exacerbated. As a result, AXTI's stock price is excessively discounted by any extreme valuation measure. To put the current price in perspective, AXTI's share price has fallen to a level it traded at in 2007. Yet in 2007 revenues/eps were $58m/$0.16c vs. today at $95m/$0.59c. Clearly, the price drop is excessive in relation to the tremendous growth and operational improvement AXTI has experienced and will see going forward.
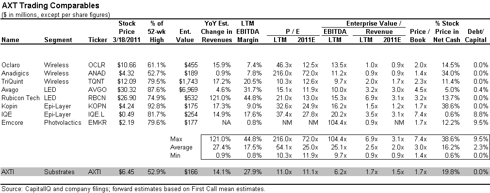
The trading value comparables indicate AXTI has one of the best EBITDA margins, and growth prospects, yet trades at a meaningful discount to peers such as TriQuint (TQNT), Oclaro (OCLR), Avago, Rubicon Technology (RBCN), Kopin (KOPN), Emcore (EMKR), Anadigics (ANAD) and IQE.
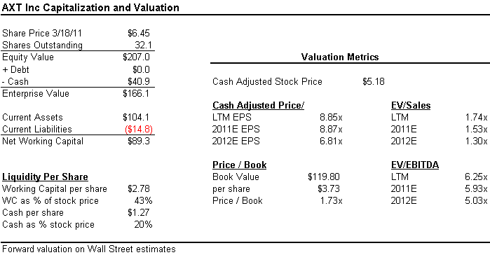
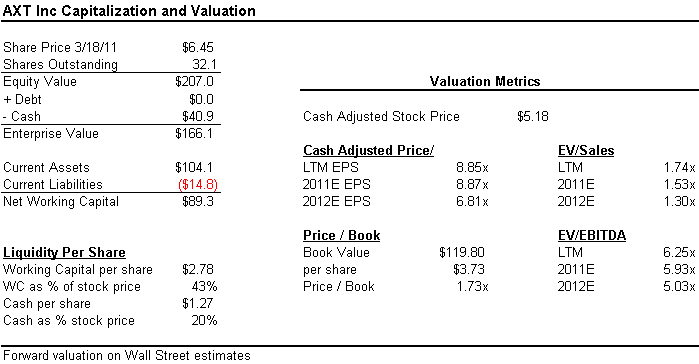
The balance sheet is strong with plenty of cash and no debt. I calculate the working capital per share is $2.78 vs. a $6.45 stock price. Looked at another way, almost 45% of the stock price is in working capital. Alternatively, with $1.27 in cash, ~20% of the stock price is backed by cash. These figures offer exceptional margin of safety at today's price.
On a cash-adjusted basis, AXTI's sub 9x P/E valuation looks even more compelling as does a forward EBITDA multiple below 6x.
Catalysts:
AXTI is now in the penalty box with analysts and quant funds after the past quarter; it's now a show-me story and will have to prove out that Q1 is just a seasonal hiccup and not indicative of broken growth prospects. Catalysts will be new client wins, analyst upgrades, LED pick-up, indicatons of increasing market share due to Japan disruption, advancement of CPV solar technology, margin preservation and expansion in the face of rising input costs.
Risks:
Disclosure: I am long AXTI.
Company Overview:
AXTI is a leading developer and producer of high-performance compound and single element semiconductor substrates, including substrates made from gallium arsenide (GaAs), indium phosphide (InP) and germanium (Ge). The substrates are primarily semi-insulating and semi-conducting.
End Markets: Power amplifiers and radio frequency integrated circuits for wireless handsets (cell phones), direct broadcast television, high-performance transistors, satellite communications, high brightness light-emitting diodes, optical couplers, satellite and terrestrial solar cells, lasers, and optical couplers.
Manufacturing: AXTI manufactures all semiconductor substrates using its proprietary vertical gradient freeze (VGF) technology. Most of its revenue is from sales of GaAs substrates. It manufactures all of its products in China, which generally has favorable costs for facilities and labor compared with comparable facilities in the United States, Europe or Japan. It also has five joint ventures in China that provide pricing advantages, reliable supply and shorter lead-times for raw materials central to final manufactured products.
Customers: Its 10 largest customers for 2010 were: Avago Technologies Trading Ltd. (AVGO); AZUR Space Solar Power GmbH; Beijing China Crystal Technology Ltd.; Hitachi Cable Ltd.; The IQE Group; Nan Da Guang Dang; Osram Opto Semiconductors GmbH; Sumika Electronic Materials, Inc.; Sumitomo Chemical Co. Ltd. (SOMMF.PK) and Visual Photonics Epitaxy Co.
Competition: Primary competition in the market for compound semiconductor substrates includes Beijing Compound Crystal Technology, Ltd.; Freiberger Compound Materials; Mitsubishi Chemical Corporation; and Sumitomo Electric Industries. AXTI believes at least two of its competitors are shipping high volumes of GaAs substrates manufactured using a technique similar to its VGF technique. In addition, it also faces competition from compound semiconductor device manufacturers that produce substrates for their own internal use, including Hitachi (HIT), and from companies such as IBM that are actively developing alternative compound semiconductor materials. AXTI is the only compound semiconductor substrate supplier to offer a full suite of raw materials.
Investment Thesis:
AXTI's business model is attractive for a number of reasons including:
1. High barriers to entry in its industry with a supply chain that is nearly impossible to replicate. It has joint venture ownership interests in numerous Chinese companies that control extremely rare and critical materials called gallium, germanium and indium. These materials are so limited in production that they were labelled as critical materials by the EU.
These JVs were set up over the course of the past 10 years, and represent significant hidden value to shareholders. The JVs ensure critical raw materials in the supply chain and partially insulate the company against the cost pressures facing its competition. The company spent the better part of the decade optimizing its supply chain and seeking high client qualification requirements to win business and slowly take market share. Given China's increasingly tight grip on rare earth elements and critical materials in the past few years, it would be extremely difficult, if not impossible, to reproduce what AXTI has accomplished.
[Click all to enlarge]

2. Few competitors and increasing market share. There are very few competitors in the markets AXTI sells to, and none control the supply chain like it does. A few main competitors are located in Japan, and as of this write-up, there are reports that Hitachi Cable has had some severe issues and may be offline for several weeks or even a couple of months. Competitor Sumitomo appears to be nearly unaffected, as its crystal growth is well south of Tokyo. Nevertheless, given the precarious position of having a high concentration of supply in Japan, customers may increasingly turn to AXTI for a more secure/stable source of product supply. Given capacity expansions in recent years and further planned expansion, AXTI may be best positioned to respond to customer demands.
3. Operating leverage: There's tremendous operating leverage in the business due to its low cost operations in China. While sales have grown at a 5yr CAGR of 38%, SG&A has grown at sub 2%. SG&A margin has fallen from almost 50% in 2005 to 14.6% in 2010. Likewise, years of R&D spending are finally paying off and have decreased from 6.5% of sales in 2005 to 2.4% of sales in 2010. Most R&D spending goes to process improvement and manufacturing efficiency research. Gross margin improvement has increased from the mid-20% range in 2008/2009 to a record 39.8% in Q4'10. This margin improvement is despite increasing gallium/germanium/indium raw material costs. Management has guided steady state gross margins in the 35-40% range, so anything above 40% represents material upside.

4. Minimal capex requirements to expand capacity to meet growing customer demand: Total manufacturing space in China is ~190,000 square feet, 160,000 square feet of which is currently being used; the company is currently preparing the remaining 30,000 square feet for increased wafer processing. It also expects to begin construction of a new 80,000 sq ft facility in Beijing. Competitors typically purchase crystal growing furnaces from original equipment manufacturers. In contrast, AXTI designs and builds its own VGF crystal growing furnaces, which it believes should allow it to increase production capacity more quickly and cost-effectively. Total capex is estimated to be $11m in 2011 and should easily be covered by cash from operations.
Recent Developments:
AXTI's share price had steadily been rising throughout 2009-2010 as it recovered from the industry downturn and proved capable of consistently delivering earnings ahead of its guidance. The company attracted two research brokers, including Needham and Northland, who each placed $10+ targets and backed the company's outlook for strong secular growth.
In the recent quarter, the company met its quarterly estimates, but offered softer Q1'11 guidance than the overly bullish analysts had hoped for by only 2 cents, due to a seasonally weak Q1 LED market. Even though the company's Q1'11 guidance range of $0.11-0.13 cents/share represents 28-63% growth over Q1'10 results of $0.08 cents/share, analysts aggressively cut estimates for 2011 almost to the point of expecting no EPS growth, and the stock has fallen over 50% from its highs earlier this year.
Part of the precipitous stock decline can be explained by the fact that AXTI's two largest shareholders are quant fund managers, and as short sellers piled in, the selling pressure was exacerbated. As a result, AXTI's stock price is excessively discounted by any extreme valuation measure. To put the current price in perspective, AXTI's share price has fallen to a level it traded at in 2007. Yet in 2007 revenues/eps were $58m/$0.16c vs. today at $95m/$0.59c. Clearly, the price drop is excessive in relation to the tremendous growth and operational improvement AXTI has experienced and will see going forward.
The trading value comparables indicate AXTI has one of the best EBITDA margins, and growth prospects, yet trades at a meaningful discount to peers such as TriQuint (TQNT), Oclaro (OCLR), Avago, Rubicon Technology (RBCN), Kopin (KOPN), Emcore (EMKR), Anadigics (ANAD) and IQE.

The balance sheet is strong with plenty of cash and no debt. I calculate the working capital per share is $2.78 vs. a $6.45 stock price. Looked at another way, almost 45% of the stock price is in working capital. Alternatively, with $1.27 in cash, ~20% of the stock price is backed by cash. These figures offer exceptional margin of safety at today's price.
On a cash-adjusted basis, AXTI's sub 9x P/E valuation looks even more compelling as does a forward EBITDA multiple below 6x.
Catalysts:
AXTI is now in the penalty box with analysts and quant funds after the past quarter; it's now a show-me story and will have to prove out that Q1 is just a seasonal hiccup and not indicative of broken growth prospects. Catalysts will be new client wins, analyst upgrades, LED pick-up, indicatons of increasing market share due to Japan disruption, advancement of CPV solar technology, margin preservation and expansion in the face of rising input costs.
Risks:
- Wireless mobile, LED and terrestrial CPV solar markets are not in secular growth period.
- LED softness in Q1'11 is more than seasonal correction and will be prolonged.
- AXTI's JV ownership does not represent a strategic competitive advantage in its industry and are not hidden value.
- JVs in raw material suppliers will not allow AXTI to control input cost inflation and gross margins reduce materially below the 35-40% indicated by management.
- Transition to lower cost compound semi substrate technology.
- Delays in capacity expansion leading to inability to deliver for clients.
- Disruptions in Japan have a net short term negative effect on the company.
Disclosure: I am long AXTI.
Cash for Mobile Phones . But in 99% cases correct..
ReplyDeleteThis is my first time I go post. I collected so many interesting things in your site especially its discussion. From the tons of comments on your posts, I guess I am not the only one having all the enjoyment here! Keep up the good work. Regards a good crib mattress can be ruined by a baby that wets through.
ReplyDeleteI am not a big fan of technical analysis. The thing that amazes me most when someone using technical analysis trys to pick a bottom on a stock based on the chart pattern. I have been investing in stocks for a very long time. The most complex thing to predict is a bottom on a stock. Its much harder to predict a bottom than a top on a stock. Another thing stocks tend to fall a lot further and faster than they tend to advance. A simple solution to the problem is just buy more shares than you bought the last time when the stock declines further.
ReplyDelete