Sunday, December 12, 2010

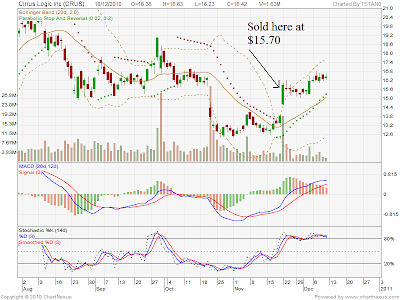
My Cirrus Logic Trade Result

Date Bought: Nov 19, 2010
Price: $13.75
Quantity: 8,000
Reason Bought: All 3 Important Technical Indicators shown a buy signal. MACD remain at the bottom (the blue line has cross over to the red line) it means that there is much more room for the CRUS to go higher. However, I am not really comfortable with the bollinger band cause it was at the upper of the side which shows almost over bought.
Mistake: Should have buy earlier at $13.40, but hesitated, so ask my wife to cancel for me while I attended the ARFF event. Shouldn't have attend the fuck up event. But the beer was good. :)
Lesson to be learned: Should not have hesitated, should have buy for the long term.


Date Sold: Nov 22, 2010
Price: $15.70
Quantity: 8,000
Reason Sold: I sold at this price because:
1) I am a bit worry that the price has jump up too fast and it might consolidate back to $14 level to fill back the gap. However, I was wrong at this point in time because obviously the run up is to strong for Crus to come back down to fill the gap.
2) The stochastic is already at the upper end of the side, I thought that it was ripe for some profit taking, but truly it was not the case.
3) I need to channel my fund to a Cisco which I find it very attractive, after the 16% gap down.
Lesson to be learned: Eventhough, I have make $15K on this transaction, I was not really satisfied cause if I think Crus is a very good share either for long or short term. As long as the demand for Apple products is strong. I believe Crus will continue to outperform in the neart future. I hope that Crus will consolidate within these few weeks cause I would like to enter again, however, once entered, I will stick for a long term which is at least 3 months down the road.

Profit Loss: $15,600

Thursday, December 9, 2010

Is Flotek Industries Inc a Buy?

 
Is Flotek a buy? Well, lets analyze it together as per below:

3 years view on the chart shows that Flotek has been on a downtrend move for a very long time. Time might be ripe for a huge rebound that can send the stock to double or even triple in price.
Moreover, the oil price has been going up from $35 level to more than $85 level now. Those companies  that are in the oil industry are expected to rise in their share prices.

Flotek Industries, Inc. (Flotek) is a diversified global supplier of drilling and production related products and services to the oil and gas industry. Its core focus is oilfield specialty chemicals and logistics, downhole drilling tools and downhole production tools. It operates under three segments: Chemicals and Logistics, Drilling Products and Artificial Lift.
Technically:
However, for the near term look, the chart doesn't look positive. 
1) Stochastic indicator already shown that the blue like has crossed over to below the red line and it is still in the beginning stage.
2) Important indicated MACD shown that the blue line has already touched the red line and is on the process of crossing over. 
When these 2 negative indicators combined, the chances of this stock going down is very high, based on my experience.
3) However, Parabolic reversal does not show a negative signal yet. I have already expected that Parabolic is still showing positive signal because Parabolic signal is usually a late indicator when the trend does reversed. 

I believe for the short term (within these few weeks), this stock will probably consolidate find its support at mid level of Bollinger band which is $3.6.

Fundamentally:
This stock does show some improvement on the quarterly earning.

Q4 2009 = -0.41
Q1 2010 = -0.34
Q2 2010 = -0.12
Q3 2010 = -0.05

Although, it is still in the negative side, however, as you can see from quarter to quarter, it does show tremendous improvement, probably due to the increase in the oil price.

Summary:
For the longer term, this might be a good play, however, for the short term, wait for it to consolidate further before jumping into this stock.

Will Dryships Continue Its Upward Move

The million $ question is will Dryships continue its upward move. Likely but not necessarily. Based on the Technical Analysis that I have circle above, it does not looks good.

As per the stochastic, the blue line already touch the red line and it looks like it is crossing over to below the red line.

As per the MACD, the red bar appears to show the weaknesses in Dryships.

As per the candlestick chart, the last few days pattern, if combine, is showing a shooting star pattern which is an indication of stock reversal or bearish sign.

Based on my believe, the near short term for this stock is bearish. However, there is a slight chances the stock might go against what I have predicted and bring this stock higher.

If I have money on hand, I will wait for this stock to show clearer picture first before jumping into this ship and get your hand burn.

Good luck!

Cisco will Continue to Outperform.

I believe now is good time to buy Cisco because it is the best Christmas deal available either fundamentally or technically.

As per the circle that I have drawn in the picture above, all the circles indicated positive sign which I believe will take the stock higher.

My 1st target that I am very sure it will hit is at $21 within weeks. The second target is at $24 within months.

The chances of the stock reversing to the downside is there, however, my analysis and experience tell me that the odd is that Cisco will move higher from here. I believe all the selling has been well absorbed and the buyer is waiting at the sideline to push the stock higher.

Moreover, Cisco is a good fundamental stocks and the company announce that they will start issuing dividend next year. I believe that when Cisco eventually distribute the dividend, it will become a darling stock again.

Lets us all pray that the stock go higher as I have bought a large amount at $19.67 level.
Below are the latest upgrade from Oppenheimer:

Cisco: Oppenheimer Says Buy, The Worst Baked In

By Tiernan Ray

Shares of Cisco Systems (CSCO) are up 29 cents, or 1.5%, at $19.36 after Oppenheimer & Co.’s Ittai Kidron this morning raised his rating on the stock to Outperform with a $23 price target, writing that sentiment is so bad on the company, it’s a good time to consider owning the shares.
Kidron cut his estimate for the fiscal year ending next July to $43.1 billion from a prior $44.2 billion, below Street consensus of $43.67 billion. His EPS estimate, at $1.60, is down from a prior $1.67 and below the Street’s $1.61.
Those numbers “appropriately reflect concerns of share losses and maring pressure,” writes Kidron. Though things could be “bumpy” for the stock, Kidron argues his reduced view, and the negative sentiment on the company, both capture the prospect of further erosion by competitors.
Kidron’s gone through the product line, trimming estimates in areas such as the set top box business (housing woes), while taking a bullish view of things such as the Unified Compute Server, the core of Cisco’s push into data center computing. He notes that that business is on a half-a-billion-dollar run rate, as of the first quarter of this fiscal year, with 2,800 customers.

Monday, December 6, 2010

Applied Materials Inc - A long term Buy?

Technical Analysis:
1) Both Stochastic and MACD are showing positive signal.
2) The target and next resistance is now at $13.60, which shows on the above chart.
3) The strong uptrend line has not been broken. It shows that chart is still very strong and moving upward.

Fundamentally:
Below are the EPS for the past 4 quarters:
1) Quarter 1, 2010= $0.13
2) Quarter 2, 2010= $0.22
3) Quarter 3, 2010= $0.29
4) Quarter 4, 2010= $0.36

Based on the increasing quarterly profit for AMAT, the fundamental for this strong is very strong.

It is definitely a buy from me based on my above analysis. I have found an interesting article as per below:-

Applied Materials, Inc. Growing its Revenues with 122.10% - NASDAQ:AMAT

From: www.GalaxyStocks.com

22 November 2010

Applied Materials reported its earnings results on November 17th which was stronger than expected. For the fourth quarter of fiscal 2010 ended October 31 company generated orders of $3.03 billion, net sales of $2.89 billion, operating profit of $699 million, and net income of $468 million or $0.35 per share. Non-GAAP net income was $476 million or $0.36 per share. With these strong results the share price significantly surged from $12.38 on 17th November to $12.65 on 18th November. There was also an exponential rise in the volume which became 21.84 million right after earnings announced when the volume was 14.72 million shares.

Performance on November 19, 2010 of Applied Materials, Inc. NASDAQ:AMAT reduced 0.94% with the closing price of $12.53. The overall volume in the last trading session was 16.92 million shares. Its fifty two week range was $10.27- $14.94. The total market capitalization remained $ 16.74 billion.
Company disclosed its latest financials by Aug 1, 2010. According to the reporting company had positive results generated through its operations. Company had trailing twelve months operating margin of 16.48% while the operating margin included 7.42%. A high operating margin is good for company to easily cater with its fixed costs. On the earnings side the total return on assets recorded 8.31% while the return on equity remained 8.50%.
Over the last quarters Company’s revenue significantly grown with 122.10%. The total trailing twelve months revenue was recorded $ 8.19 billion while the net income available to common stock holders was recorded $ 607.71 million.
In arranging the capital management remained less reliant on debt. The total debt, in the most recent quarter, was recorded $ 206.29 million and the total cash remained $ 2.35 billion. This combination resulted in debt to equity ratio of 2.83. Management also increased the investment activities. The short term investments were $ 738,433,000 on May 2, 2010 which then surged to $ 783,799,000 as on Aug 1, 2010. The long term investments were $ 1,230,214,000 on May 2, 2010 and then increased to $ 1,279,515,000 on Aug 1, 2010.
Applied Materials, Inc. (Applied) provides Nanomanufacturing Technology solutions for the global semiconductor, flat panel display, solar and related industries, with a portfolio of equipment, service and software products. The Company’s customers include manufacturers of semiconductor wafers and chips, flat panel liquid crystal displays, solar photovoltaic cells and modules (solar PVs), and other electronic devices. It operates in four segments: Silicon, Applied Global Services, Display, and Energy and Environmental Solutions. Applied’s Silicon Systems Group (SSG) develops, manufactures and sells a range of manufacturing equipment used to fabricate semiconductor chips, also referred to as integrated circuits (ICs).


Thursday, December 2, 2010

Analysis for 100% Gain Stock Part 2

I have bought this stock CSCO at the price of $19.67, although the current price is $19.22, do I feel scare or regret? Not at all, instead I feel great and I believe that at least 10% gain for this stock is unavoidable.

The reason:
1) The MACD histogram shown that the blue line is very close to touch the red line and is almost crossing over with a nice curving up.
2) As for the Stochastic it the blue line and the red line have already met for some time and the blue line is waiting eagerly at the side to cross over.

I believe the time is ripe for CSCO to gain back at least 10% or more to cover the gap. All technical indicators is pointing to a buy.

I do not ask you all to buy, however, please check back to prove that I am correct and also that I will make at least 10% can in 7 days.
10% = $10,000
Stay tune.
Related Posts Plugin for WordPress, Blogger...